
Polarimeter Systems with High Dynamic Range

- Three Models Cover Wavelengths from 400 to 1700 nm
- Rotating-Wave-Plate-Based Measurement Gives ±0.25° Accuracy
- High Dynamic Range of 70 dB
- Accepts Free-Space or Fiber-Coupled Input
Accessories for Fiber-Coupled Optical Input Included
PAX1000IR2
Application Idea
The orientation of a WPH05M-532 half-wave plate mounted in a CRM1PT 30 mm cage rotation mount is adjusted with the aid of a PAX1000VIS polarimeter.
OVERVIEW
Example Configurations (from Left to Right):
- The measurement head accepts a free-space optical input beam up to Ø3 mm.
- A collimator, adapter, and SM1-threaded lens tube are included for fiber-coupled optical input.
- The PAX1000VIS(/M) includes an end cap with laser-etched cross hairs to aid in beam alignment.
- The PAX1000IR1(/M) and PAX1000IR2(/M) include VRC2SM1 IR alignment disks with mounting adapters.

Click to Enlarge
Software GUI for the PAX1000 Series Polarimeter Showing Equally-Sized Polarization Ellipse and Poincaré Sphere Measurement Windows
Features
- Three Wavelength Ranges Available
- 400 nm - 700 nm
- 600 nm - 1080 nm
- 900 nm - 1700 nm
- Rotating-Wave-Plate-Based Measurement
- High Dynamic Range of 70 dB
- Excellent Azimuth and Ellipticity Accuracy of ±0.25°
- Sampling Rate up to 400 Samples/s
- Beam Terminates Inside the Module
- Ø3.0 mm Free-Space Beam Input or FC/PC Fiber Input
- Fully Featured Software Includes Alignment Tool and Extinction Ratio Measurement Tool
Applications
- Free-Space and Fiber-Coupled Polarimetry
- Degree of Polarization (DOP) Measurements
- Extinction Ratio (ER) Measurements
- Component for a Polarization Dependent Loss (PDL) / Polarization Mode Dispersion (PMD) Measurement System
Thorlabs' PAX1000 Series of Polarimeters measure the state of polarization (SOP) of collimated input light using the rotating-wave-plate method. Three models cover the visible to near-infrared wavelength range. Optical input must be monochromatic coherent light (i.e. laser light), and the light terminates inside the module. These polarimeters have a high 70 dB dynamic range, and they provide azimuth and ellipticity accuracies of ±0.25° on the Poincaré sphere. When electrical power is supplied via the USB 2.0 port, measurements can be at rates between 50 and 100 samples/s. When the polarimeters are powered using the included DS15 power supply, they can achieve measurement rates between 50 and 400 samples/s. Software, available for download on the Software tab, enables measurements from up to five measurement heads to be simultaneously acquired. For more information, please see the Operation tab.
The measurement head accepts a free-space collimated beam up to Ø3.0 mm. Input from an FC/PC-terminated optical fiber can be coupled to the module using the included wavelength-appropriate F240FC Series Fiber Collimator, SM1M10 Lens Tube with SM1 (1.035"-40) internal threads, and KAD12F SM1 threaded adapter. Free-space and fiber-coupled configurations are shown at the left and second left, respectively, in the above image. If you would rather receive a fiber collimator that accepts FC/APC connectors, please contact Tech Support. The F240APC series collimators for FC/APC connectors are also available separately. Accessories from Thorlabs' selection of 30 mm Cage System components can be attached using the four 4-40 threaded holes located on the front panel.
Software
The software for these polarimeters includes an intuitive GUI that provides multiple ways visualize the measurement data: measurements can be plotted on a polarization ellipse, the Poincaré sphere, and/or a graph, as well as displayed in tabulated format. The GUI also features an easy-to-use alignment tool to help the user optimally align the input beam, which is critical for ensuring accurate measurements. In addition, for those interested in measuring the polarization-maintaining (PM) performance of a PM optical fiber, the software includes an extinction ratio tool with the option to correct this measurement for absolute ellipticity and degree of polarization.
Measurements from up to five different sources, which include physical polarimeters, virtual devices, and saved data loaded from files, can be displayed simultaneously. The software provides control over sample rates and data averaging preferences. Long-term measurements are also supported. These measurements save a range of time-stamped data to a file according to the settings specified during the measurement setup. Long-term measurements can be acquired while using the software to acquire and manipulate measurements from other devices.
Recalibration Service
Recalibration services are available for our PAX1000 series polarimeters. To order this service, scroll to the bottom of the page and enter the Item # and Serial # of your device before adding the calibration service to your cart. A Thorlabs representative will contact you with an RMA number, which you will use to return your device for calibration.
SPECS
Specifications
| Item # | PAX1000VIS(/M) | PAX1000IR1(/M) | PAX1000IR2(/M) | |
|---|---|---|---|---|
| Optical Parametersa | ||||
| Wavelength Range | 400 nm - 700 nm | 600 nm - 1080 nm | 900 nm - 1700 nm | |
| Dynamic Range | -60 dBm to +10 dBm (10-6 mW to 10 mW) |
|||
| Sampling Rate | Defaultb | 30 Samples/s | ||
| Maximumc | 400 Samples/s | |||
| Measurable SOPd | Entire Poincaré Sphere | |||
| Azimuth Accuracye | ±0.25° | |||
| Ellipticity Accuracy | ±0.25° | |||
| DOPf Accuracy | ±1.0% | |||
| Free Space Aperture | Ø3 mm | |||
| Input Fiber Connector | FC/PC Accepted by Included Ø12 mm Collimatorg | |||
| Included Ø12 mm Collimatorg | F240FC-A | F240FC-B | F240FC-C | |
| Maximum Input Beam Divergence | 2° | |||
| Warm-Up Time for Rated Accuracy | 15 min | |||
| Additional Specifications | ||||
| Command and Control Interface | USB 2.0 Mini-B | |||
| Input Power Supply | Via USB 2.0 Mini-B Interface or DS15 External Power Supplyh |
|||
| DS15 Power Supply Ratings | 15.0 V; 1.2 A | |||
| Operating Temperature Range | 5 °C to 40 °C | |||
| Storage Temperature Range | -40 °C to 70 °C | |||
| Dimensions | 51.0 mm x 55.0 mm x 56.3 mm (2.01" x 2.17" 2.22") |
|||
| Bottom Mounting Features | One 1/4"-20 (M6) and Two 8-32 (M4) Threaded Holes | |||
| Weight | 0.28 kg (0.62 lbs) | |||
Note: All technical specifications are valid at 23 ± 5 °C and 45 ± 15% non-condensing relative humidity.
Front Panel Features

Click to Enlarge
PAX1000IR1 Polarimeter Configured for Free-Space Optical Input
| Front Panel of the PAX1000 Series Polarimeters | |
|---|---|
| Callout | Description |
| F1 | 4-40 Tapped Hole, 5.5 mm Max Screw Engagement Length (4 Places) for Thorlabs' 30 mm Cage System Components |
| F2 | SM1 (1.035"-40) External Thread |
| F3 | SM05 (0.535"-40) Internal Thread |
| F4 | Ø3 mm Optical Input Aperture |
Back Panel Features
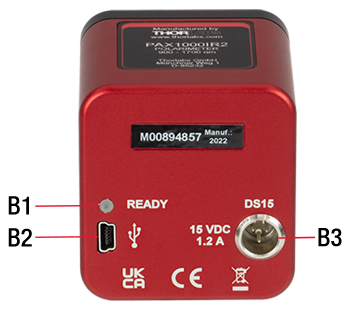
Click to Enlarge
Back Panel of PAX1000IR2 Polarimeter
| Back Panel of the PAX1000 Series Polarimeters | |
|---|---|
| Callout | Description |
| B1 | Status LED "Ready"a |
| B2 | USB Mini-B Connector for PC Control and Powerb |
| B3 | Port for Mini-XLR Connector of Included External DS15 Power Supplyb |
OPERATION
Operating Principle
Click to Enlarge
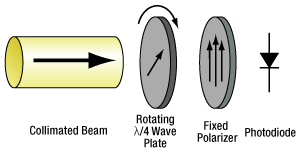
Figure 1: Rotating Wave Plate Technique
The PAX1000 series polarimeters are based on the rotating quarter-wave plate technique. The input light must be monochromatic and coherent (i.e. laser emission) with a known wavelength. As shown in Figure 1, the input light is collimated and normally incident on a rotating true zero-order quarter-wave plate. After the wave plate, the light passes through a fixed linear polarizer and then terminates on a photodiode.
The polarization state of the light output by the quarter-wave plate changes as the wave plate rotates. The polarizer transmits only the component of light polarized along its transmission axis. As the rotating wave plate results in a continuously changing polarization state incident on the polarizer, the amplitude of the light transmitted by the polarizer, and incident on the photodiode, is modulated. The photodiode converts the modulated optical intensity to a modulated photocurrent. This setup produces photocurrent that has a DC term, a term proportional to twice the rotation frequency of the wave plate, and a phase-shifted term proportional to four times the rotation frequency of the waveplate. Fourier analysis is used to find the amplitude coefficients of each of these frequency-dependent terms, and then the Stokes parameters are calculated from those coefficients.
True Zero-Order Quarter-Wave Plate
A wave plate is a birefringent optical element through which light polarized along the fast axis travels at a faster velocity than light polarized along the orthogonal slow axis. The thickness of a quarter-wave plate transforms linearly polarized light to elliptically polarized light, and vice versa, by creating a phase delay of 90°, plus some integer multiple of 360°, between the two orthogonal polarization components.
Thorlabs uses true zero-order quarter-wave plates in the PAX1000 series polarimeters, as the highly accurate measurements of these polarimeters cannot be achieved with other types of quarter-wave plates. True zero-order wave plates possess the minimum thickness necessary to produce a phase difference of exactly 90°. Key characteristics of true zero order wave plates include high retardance accuracies, low temperature dependence, low wavelength dependence, and lower sensitivity to angle of incidence than other wave plates. Wave plates with greater thicknesses, but which are constructed to share some performance characteristics with true zero order wave plates, are more common. Examples are pseudo-zero-order and achromatic wave plates, which are constructed by cementing two different wave plates into a single assembly. The fabrication process of the pseudo-zero order and achromatic plates results in a small misalignment error between the component plates' fast and slow axes, which causes unacceptably large errors in the polarization measurements made using the rotating wave plate technique.
The wavelength dependency of the true zero-order wave plates used in the PAX1000 series polarimeters determines the operating range of each model.
Pulsed vs. CW Input Light
While the PAX1000 series polarimeters assume the incident light beam is unmodulated, input light with pulse repetition rates >1 kHz will also yield accurate measurements. This is due to the limited bandwidth of the photodiode. Pulsed light with a high repetition rate is effectively integrated by the photodiode during the detection process, which results in the generation of a continuous wave (CW) photocurrent. When the pulse repetition rate of the input light is <1 kHz, the photodiode's bandwidth is sufficient to resolve the individual pulses. For these lower pulse rates, the modulation due to the pulsed nature of the light is not accounted for during the data analysis. The unexpected term in the measurement data related to the laser pulses may result in errors in the calculated polarization state.
Using the Included Accessories to Enable Fiber-Coupled Input
To enable the PAX1000 to accept fiber-based input, screw the SM1M10 lens tube onto the external SM1 threads on the front panel of the module. Insert the F240FC series fiber collimator into the KAD12F adapter, and tighten the set screws to hold the fiber collimator securely. Screw this assembly into the open end of the SM1M10 lens tube. With the assistance of the Alignment Tool in the software, which is described below and in the manual, optimize the alignment of the fiber collimator using a 5/64" (2.0 mm) hex key to rotate the pitch and yaw adjustment screws on the adapter. If you would rather receive a collimator that accepts FC/APC connectors with your PAX1000 series polarimeter, please contact Tech Support. The F240APC series collimators for FC/APC connectors are also available separately.
Polarization Measurements using the Software GUI
Software with an intuitive and graphical user interface (GUI) with multiple user-configurable attributes is available for the PAX1000 Series of polarimeters. Please note that this software is not backwards compatible with previous generations of Thorlabs' polarimeters.
State of Polarization
The convention the software, manual, and quick start guide use to describe the polarization state assumes the (virtual) observer looks into the beam, towards the light source.
Sample Rates
Sample Rates depend on both the rotation rate of the quarter-wave plate and the number of rotations over which the data are acquired. Each half-turn of the waveplate acquires a full period of data, which is sufficient for determining the state of polarization. Acquiring data over multiple half-turns of the waveplate can improve measurement accuracy and noise levels, as the output of the fast Fourier transform (FFT) data processing step often improves as the number of periods included in the input data set increases. When the optical signal power is low or significant noise is present on the signal, measurement data quality is improved by reducing Basic Sample Rate, which reduces the rotation rate of the quarter-wave plate, and acquiring data over multiple half-turns.
The software provides the option of selecting whether polarization measurements are calculated using data acquired during one half, one full, or two full rotations of the quarter-wave plate. As the quarter-wave plate is driven at revolution rates between 25 Hz and 200 Hz by a low-vibration DC motor, the associated Sample Rates are:
- 50 Hz to 400 Hz (Half Rotation)
- 25 Hz to 100 Hz (Full Rotation)
- 12.5 Hz to 50 Hz (Two Full Rotation)
Please see the Chapter 5 of the manual for detailed information describing the sampling rate settings.
Click to Enlarge
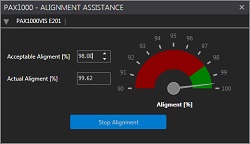
Figure 3: Optimized Alignment
Alignment Tool
Correct alignment of the input beam is crucial for accurate measurements. The beam is optimally aligned when it is normally incident on the rotating wave plate and centered in the input aperture. Centering the beam becomes more important as the beam diameter approaches the 3.0 mm diameter of the input aperture. Off-center beams, as well as beams that are not normally incident on the wave plate, scatter from surfaces inside the polarimeter and contribute unwanted components to the optical signal incident on the photodiode. The resulting artifacts in the photocurrent produce errors in the polarization measurement. Poorly centered beams may also be clipped by the input aperture.
To assist with the alignment process, Thorlabs has developed an alignment tool. The alignment tool can be opened through the TOOLS tab on the toolbar, which is described in the following section. As shown in Figure 2, the tool consists of a scale with red and green regions. The indicator needle on the scale, and the numerical value readout to the left of the scale, shows the fraction of desired components in the photocurrent. In Figure 2, the indicator needle is in the red region, which corresponds to an unacceptably poor alignment. Improving alignment reduces contributions from scattered light, which increases the fraction of desired components in the photocurrent. The size of the green range is set using the Acceptable Alignment control to the left of the scale. As a rule, good alignment is achieved when the alignment is better than 98%. However, the alignment should be optimized as much as possible, as it is in Figure 3.

Click to Enlarge
Figure 5: Measurements from up to five sources,
including physical and virtual devices as well as
data saved to a file, can be plotted to this view.

Click to Enlarge
Figure 4: Main Screen of the GUI with the Poincaré Sphere
and Polarization Ellipse Views Active and Equally Sized
Key Features of the Display
The GUI, whose main screen is shown in Figure 4, consists of several elements. Related functions are grouped under the different tabs of the toolbar, visible at the top left of the screen in Figure 4. In the example shown, the toolbar tab labeled DEVICE is selected, under which Scan USB, Add Virtual Device, Devices & Measurements, Device Settings, Reset All and Pause/Run functions are organized.
Data are displayed in the large area below the toolbar section. Measurement display windows of interest can be added to this region using the VIEW tab in the toolbar. These different views can then be organized, and their sizes and other appearance attributes modified, by the user. The example in Figure 4 shows the Polarization Ellipse and the Poincaré Sphere Views active and sized equally. The views that may be enabled are:
- Polarization Ellipse
- Poincaré Sphere
- Scope Mode
- Extinction Ratio Measurement
- Long Term Measurement
- Measurement Value Table
A Status Bar, located at the bottom of the page, indicates error events and communicates information about long term measurement progress, including an actively-updated progress bar.
Multiple Active Devices
The software for the PAX1000 series allows measurements from up to five of any combination of physical devices, virtual devices, and saved files to be simultaneously displayed. Figure 5 shows measurement data plotted on the Poincaré sphere from four different sources: two physical devices (red and blue labels), one virtual device (green label), and one measurement loaded from a file (fuchsia label). Connecting a virtual device allows the measurement functionality of the software to be explored in the absence of a physical device. The virtual device is based on the default settings of the PAX1000IR1.
Polarization Ellipse View
The Polarization Ellipse View, which can be seen on left side of Figure 4, shows the polarization ellipse calculated for the measured polarization state inscribed in a circle. A pull-down menu is used to select which active device to use as the source of the displayed data. A box in the lower left corner displays measurement parameters. In addition to the four parameters shown by default (orientation of the polarization state, wavelength, total power, and degree of polarization), the user may choose to additional parameters to display (azimuth and ellipticity, or power split ratio and phase difference, or the three normalized Stokes vectors).
Poincaré Sphere View
The Poincaré Sphere View is shown on the right side of Figure 4 and in Figure 5. Measurements from up to five sources, a combination of physical, virtual, and data loaded from a file, can be simultaneously plotted to this view. Reference markers can be placed on the sphere, either using the mouse for approximate placement or a menu function to precisely define the reference state. Other menu functions allow the appearance, maximum length, and other attributes of each trace to be defined. The orientation of and zoom factor applied to the sphere can be specified using a separate menu function. This customized appearance can be saved, so that it can be recalled later. The orientation of the sphere can also be controlled using keyboard commands or the mouse, and the sphere can be rotated to bring the most current measurement of a particular device to the front by clicking on the box at the bottom of the view that corresponds to the device. As memory limitations can result in decreased responsiveness of the GUI when large amounts of data are plotted, a total of 50,000 measurement points can be shown on the Poincaré sphere. As this total number of data points is divided among the different traces plotted on the sphere, the maximum length of each trace depends on the number of displayed traces.
Click to Enlarge
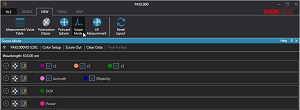
Figure 7: Four different graphs can be selected in Scope
Mode. To activate a graph of interest, click the corresponding
circled arrow located at the very left of the row.
Scope Mode View
In the Scope Mode View, the 1000 most recently measured data points for a selected set of polarization parameters are shown plotted to a graph, which is continuously updated as values are acquired. Data logging begins as soon as a device is connected, and it can be restarted by clicking the Clear Data button. Figure 6 shows a graph of the normalized Stokes parameters computed from a measurement file loaded from memory. The source of the data is specified using the drop-down menu and is one of the active physical devices, virtual devices, or loaded measurement files. Different graphs can be selected using the Scope Mode function accessed through the VIEW tab in the toolbar, as shown in Figure 7. Parameters that can be graphed are:
- Normalized Stokes Parameters: s1, s2, and s3
- Polarization Ellipse Parameters: Azimuth and Ellipticity
- Degree of Polarization
- Power
Click to Enlarge
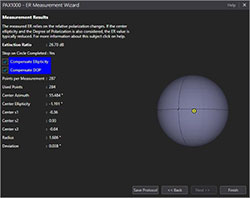
Figure 9: ER Measurement Results

Click to Enlarge
Figure 8: The ER Measurement view. The minimized
Polarization Ellipse and Poincaré Sphere views can
be expanded by clicking on the gray tabs at the
left of the screen.
Extinction Ratio Measurement View
The Extinction Ratio Measurement tool is useful in determining the extinction ratio (ER) of polarization maintaining (PM) optical fibers. To make an ER measurement, linearly polarized light with a degree of polarization as close to 100% as possible must be precisely coupled into either the fast or the slow axis of the PM fiber. The ER measurement is made while dynamically stressing the fiber under test. Two common ways of stressing the fiber are by heating it and through mechanical means, such as applying a tensile force.
The applied stress causes cross coupling of the light between the fast and slow axes of the PM fiber, and this changes the measured polarization state. During the application of a dynamic stress to the fiber, the measured polarization state continuously changes and a circle is traced on the Poincaré sphere, as shown in both Figure 8 and Figure 9. The circle should be centered near the equator of the sphere, as the light should be predominantly linearly polarized. Each measurement point represents an (azimuth, ellipticity) measurement pair. The calculation of ER requires the complete measurement set to trace at least one full circle on the Poincaré sphere. The diameter of the circle is a measure of the ER, and the smaller the circle, the higher the ER.
Please note that ER measurements made by a polarimeter are not affected by the degree of polarization (DOP) of light. This is in contrast to measurements made by an ER meter. When the ER measurements made by the polarimeter are corrected for absolute ellipticity and degree of polarization, as described in Section 8.4 of the manual, the ER value measured by the polarimeter and the ER meter agree. The software for the PAX1000 series of polarimeters allows the user to correct the ER measurement result for absolute ellipticity, DOP, or both. This preference is specified in the ER Measurement setup screen shown in Figure 8. The results of a completed ER measurement are shown in Figure 9.
Long-Term Measurement
Long-Term measurements are set up using the function grouped under the TOOLS tab in the toolbar. An extensive array of parameters, which are listed in Section 5.2.5 of the manual are recorded to file with the exact time stamp and elapsed time of the measurement. Measurement settings include file information, sampling frequency, and measurement stop criteria. Long-term measurements can be acquired while also using the software with other connected devices.
SOFTWARE

Click to Enlarge
The PAX1000 Series Polarimeter GUI Interface
GUI and Drivers for the Remote Control of PAX1000 Series Polarimeters
The download button below provides a link to the GUI and drivers that allow these polarimeters to be controlled via a PC with a Windows® operating system. The highly customizable GUI configuration of this software can be used to display measurements graphically on a polarization ellipse, a Poincaré sphere, and/or on an X-Y graph. An alignment tool is provided to optimize the beam path prior to measurement, long-term measurements are supported, and an extinction ratio (ER) tool facilitates ER measurements of polarization maintaining fibers. Measurements from up to five sources can be simultaneously displayed. These sources include physical and virtual devices displaying real-time data as well as measurements read from a file. A USB 2.0 connection is used to connect the controlling PC to the polarimeter.
SHIPPING LIST
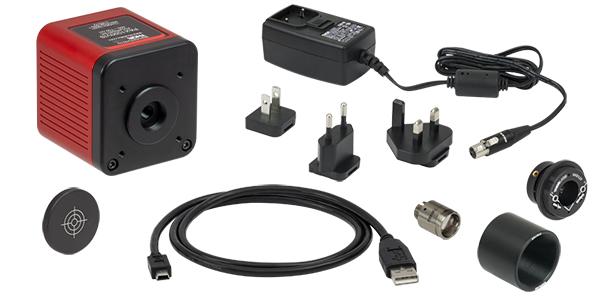
PAX1000VIS(/M)
- Polarimeter, Wavelength Range 400 nm to 700 nm
- F240FC-A Fiber Collimator (Designed for FC/PC Connectors)*
- KAD12F SM1-Threaded Adapter for Ø12 mm Cylindrical Components
- SM1M10 SM1-Threaded Lens Tube
- End Cap Laser-Engraved with Cross-Hair
- USB 2.0 Cable, 1.5 m Long, with Mini-B and A-Type Connectors
- DS15 ±15 VDC Regulated Power Supply
- Quick Reference Manual
*If you would like to instead receive a fiber collimator compatible with FC/APC connectors, please contact Tech Support. The F240APC series collimators for FC/APC connectors are also available separately.
Click to Enlarge
Components included with the PAX1000VIS(/M) polarimeters are shown above.
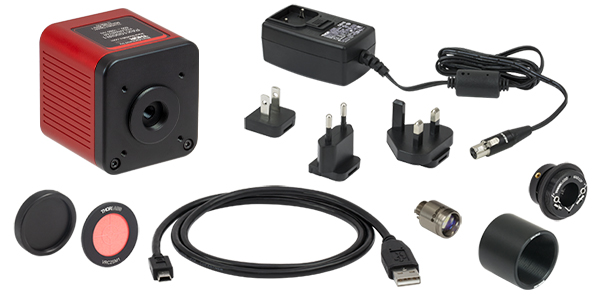
PAX1000IR1(/M)
- Polarimeter, Wavelength Range 600 nm to 1080 nm
- F240FC-B Fiber Collimator (Designed for FC/PC Connectors)*
- KAD12F SM1-Threaded Adapter for Ø12 mm Cylindrical Components
- SM1M10 SM1-Threaded Lens Tube
- VRC2SM1 Alignment Disk, with External SM1 Threads
- Mounting Adapter† for mating the VRC2SM1 to the External SM1 Threads on the Front Panel of the PAX1000IR1(/M) Module
- USB 2.0 Cable, 1.5 m Long, with Mini-B and A-Type Connectors
- DS15 ±15 VDC Regulated Power Supply
- Quick Reference Manual
Click to Enlarge
Components included with the PAX1000IR1(/M) and PAX1000IR2(/M) polarimeters are shown above.
PAX1000IR2(/M)
- Polarimeter, Wavelength Range 900 nm to 1700 nm
- F240FC-C Fiber Collimator (Designed for FC/PC Connectors)*
- KAD12F SM1-Threaded Adapter for Ø12 mm Cylindrical Components
- SM1M10 SM1-Threaded Lens Tube
- VRC2SM1 Alignment Disk, with External SM1 Threads
- Mounting Adapter† for mating the VRC2SM1 to the External SM1 Threads on the Front Panel of the PAX1000IR2(/M) Module
- USB 2.0 Cable, 1.5 m Long, with Mini-B and A-Type Connectors
- DS15 ±15 VDC Regulated Power Supply
- Quick Reference Manual
*If you would like to instead receive a fiber collimator compatible with FC/APC connectors, please contact Tech Support. The F240APC series collimators for FC/APC connectors are also available separately.
†The mounting adapter consists of internal SM1 threads on both sides of a solid disk. It functions as both an adapter and a light-tight end cap, as the VRC2SM1 is not opaque.
Polarimeters


Click to Enlarge
The DS15 power supply and mini-B USB ports are located on the back panel. The "READY" LED illuminates when power is connected.
- Three Models Available
- PAX1000VIS(/M): 400 - 700 nm
- PAX1000IR1(/M): 600 - 1080 nm
- PAX1000IR2(/M): 900 - 1700 nm
- Accessories Convert between Free-Space and Fiber-Coupled Optical Input
- Maximum Measurement Rates:
- 100 Samples/s when Powered by USB 2.0
- 400 Samples/s when Powered by Included DS15 Power Supply
- Intuitive Software with User-Configurable Display and Measurement Settings
Thorlabs' PAX1000 Series of Polarimeters measure the state of polarization (SOP) of collimated monochromatic light. Three models cover the visible to near-infrared wavelength range. Each polarimeter features one 1/4"-20 (M6) and two 8-32 (M4) tapped holes for post mounting. A power supply with a region-specific adapter is included with each polarimeter. Additional power supplies are available below.
We also offer a recalibration service for our polarimeters, which can be purchased below. We recommend yearly calibration to ensure accurate measurements.
Part Number | Description | Price | Availability |
|---|---|---|---|
PAX1000VIS/M | Polarimeter, Free Space and Fiber Coupled, 400 - 700 nm, Metric Threading | $6,277.36 | 3 Weeks |
PAX1000IR1/M | Polarimeter, Free Space and Fiber Coupled, 600 - 1080 nm, Metric Threading | $6,277.36 | Lead Time |
PAX1000IR2/M | Polarimeter, Free Space and Fiber Coupled, 900 - 1700 nm, Metric Threading | $6,277.36 | Lead Time |
PAX1000VIS | Polarimeter, Free Space and Fiber Coupled, 400 - 700 nm, Imperial Threading | $6,277.36 | Lead Time |
PAX1000IR1 | Polarimeter, Free Space and Fiber Coupled, 600 - 1080 nm, Imperial Threading | $6,277.36 | Lead Time |
PAX1000IR2 | Polarimeter, Free Space and Fiber Coupled, 900 - 1700 nm, Imperial Threading | $6,277.36 | In Stock |
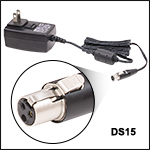
Replacement 15 VDC Regulated Power Supply
Click to Enlarge
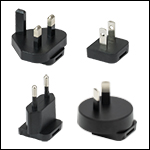
Region-Specific Adapters for DS15
- 15 VDC Regulated Power Supply
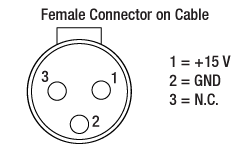
- Mini-XLR Connector
- Compatible with Our PAX1000 Series Polarimeters
The DS15 is a 15 V regulated power supply with a 1.53 m (60.24") long cable and a Mini-XLR connector. It is suitable for any Mini-XLR-compatible device that requires a 15 VDC output, and is directly compatible with our PAX1000 series polarimeters, sold above. A region-specific adapter plug is shipped with the DS15 power supply based on your location.
Part Number | Description | Price | Availability |
|---|---|---|---|
DS15 | 15 VDC, 1.2 A Regulated Power Supply with Mini-XLR Connector, 100/240 VAC | $52.48 | In Stock |
Recalibration Service for PAX1000 Polarimeters
Thorlabs offers a recalibration service for our PAX1000 Series Polarimeters sold above. To ensure accurate measurements, we recommend recalibrating the polarimeters annually.
Requesting a Calibration
Thorlabs provides two options for requesting a calibration:
- Complete the Returns Material Authorization (RMA) form. When completing the RMA form, please enter your name, contact information, the Part #, and the Serial # of the item being returned for calibration; in the Reason for Return field, select "I would like an item to be calibrated." All other fields are optional. Once the form has been submitted, a member of our RMA team will reach out to provide an RMA Number, return instructions, and to verify billing and payment information.
- Enter the Part # and Serial # of the item that requires recalbration below and then Add to Cart. A member of our RMA team will reach out to coordinate return of the item for calibration. Should you have other items in your cart, note that the calibration request will be split off from your order for RMA processing.
Please Note: To ensure your polarimeter is routed appropriately once it arrives at our facility, please do not ship it prior to being provided an RMA Number and return instructions by a member of our team.
Part Number | Description | Price | Availability |
|---|---|---|---|
CAL-PAX2 | Calibration Service for PAX1000 Series Polarimeters | $848.03 | Lead Time |


