TIR Retroreflector Prisms
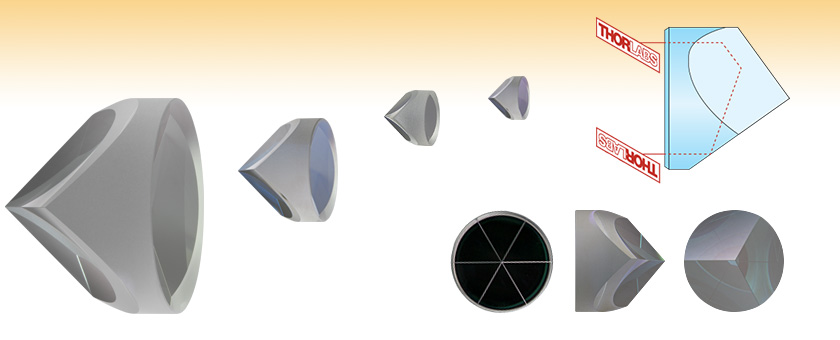
- 3 AR Coating Ranges from 350 to 1700 nm
- 180° Reflection Inverts Image
- <3 arcsec Beam Deviation
PS976
Ø50.0 mm,
Uncoated
PS975-B
Ø25.4 mm,
ARC: 650 - 1050 nm
PS974-C
Ø10.0 mm,
ARC: 1050 - 1700 nm
Front
Profile
Back
PS977-A
Ø12.7 mm,
ARC: 350 - 700 nm

Please Wait
| Common Specifications | |||
|---|---|---|---|
| Prism Material | N-BK7a Grade A Fine Anneal | ||
| N-BK7 Transmission Range | 350 - 2000 nm | ||
| AR Coating | Ravg < 0.5% at AOI = 0° | ||
| Diameter Tolerance | +0.0 / -0.1 mm | ||
| Surface Quality | 40-20 Scratch-Dig | ||
| Beam Deviationb | <3 arcsec | ||
| Design Wavelength | 633 nm | ||
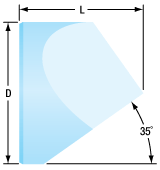
Click to Enlarge
Retroreflector Dimensions
Features
- Fabricated from N-BK7
- Reflects an Inverted and Reversed Image 180°
- Four Prism Sizes Available:
- Ø10.0 mm
- Ø12.7 mm
- Ø25.4 mm
- Ø50.0 mm
- Four Coating Options:
- Uncoated (350 - 2000 nm)
- -A Coated Entrance Face (350 - 700 nm)
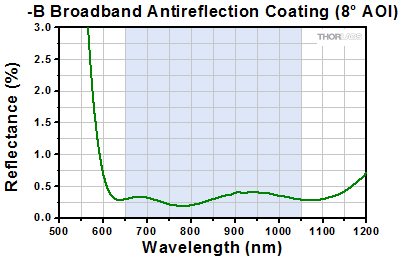
- -B Coated Entrance Face (650 -1050 nm)
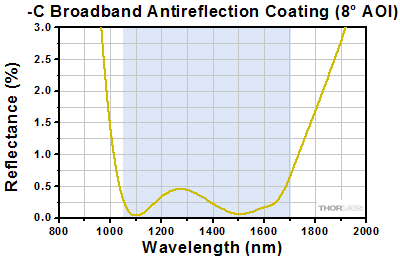
- -C Coated Entrance Face (1050 - 1700 nm)
These unmounted retroreflectors are trihedral prisms manufactured from a solid piece of N-BK7 glass. We offer uncoated retroreflectors as well as versions with antireflection (AR) coatings in one of three ranges: 350 - 700 nm, 650 - 1050 nm, or 1050 - 1700 nm. They have uncoated reflective faces and rely on total internal reflection (TIR); we also offer backside-coated retroreflectors which employ second surface specular reflections which minimize changes in polarization to <10° with minimal introduced ellipticity. Commonly referred to as corner cubes, the prisms sold here are available in four different sizes (Ø10.0 mm, Ø12.7 mm, Ø25.4 mm, and Ø50.0 mm). They are often used with translation stages to create optical delay lines.
Retroreflector Prisms
Retroreflectors reflect an image or beam back toward its original direction via three reflections. The beam or image will be inverted and reflected through 180° even if the angle of incidence is not zero. The insensitivity of the alignment of these prisms make them ideal retroreflecting optics. For these retroreflecting prisms, the incident and reflected beams will be parallel to within 3 arcsec. However, unless the incident and reflected beams strike the exact center of the optic, they will not overlap but rather be shifted with respect to each other. For example, if the incident beam strikes the optic 3 mm to the right of center, the retroreflected beam will emerge 3 mm to the left of center. The prisms are able to retroreflect beams as large as the maximum beam diameter listed in the tables below.
Additionally, the retroreflected beam will experience a change in its polarization state when propagated through a solid retroreflector. See the Lab Facts tab for more information. Note that this effect is minimized by retroreflectors with gold-coated reflective surfaces.
Mounting
Except for the Ø12.7 mm prism, each retroreflector is also offered mounted in an SM-threaded lens tube for easy integration into an optical system. However, if you wish to mount our unmounted retroreflectors, we suggest either our
Please refer to the Prism Guide tab above for assistance in selecting the appropriate prism for your application.
Click to Enlarge
Click Here for Raw Data
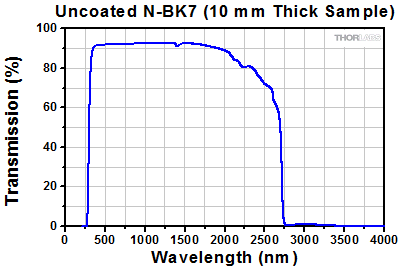
The graph above shows the transmission of a 10 mm thick N-BK7 substrate.
Click to Enlarge
Click Here for Raw Data
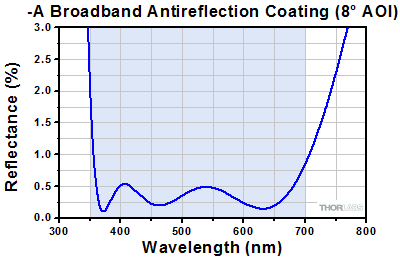
The blue shaded region indicates the specified 350 - 700 nm wavelength range where the specifications are guaranteed. Please note that this is the measured reflection per surface.
Click to Enlarge
Click Here for Raw Data
The blue shaded region indicates the specified 650 - 1050 nm wavelength range where the specifications are guaranteed. Please note that this is the measured reflection per surface.
Click to Enlarge
Click Here for Raw Data
The blue shaded region indicates the specified 1050 - 1700 nm wavelength range where the specifications are guaranteed. Please note that this is the measured reflection per surface.
Thorlabs Lab Fact: Retroreflectors Alter Polarization State
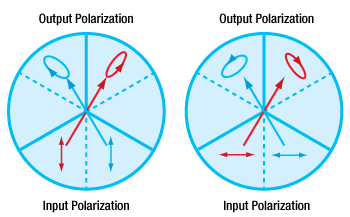
We present laboratory measurements of the polarization state of a beam retroreflected through a Thorlabs retroreflector. In a polarization-dependent experiment, it's important to understand how the polarization of the input beam is altered during retroreflection. While input beams normal to the base strike each face of the retroreflector at a roughly 55° angle of incidence [1], the s and p polarization components experience different phase delays and are split differently, depending on the order of surfaces they reflect from. The base of the retroreflector is imagined to be divided into sextants; a beam incident on any one sextant will be retroreflected through the sextant sharing the same vertical angle (see figure to the right). We find that the change in polarization is dependent upon initial polarization of the beam and input sextant.
For our experiment we used the former generation HRS015 stabilized HeNe laser (replaced by the HRS015B). The beam was retroreflected by a Ø1" N-BK7 prism retroreflector and propagated through a polarizer, after which its power was recorded. We measured beam power with the polarizer oriented horizontally, vertically, or at ±45°. Next, we inserted a quarter-wave plate into the beam path before the polarizer with the fast axis of the λ/4 wave plate aligned horizontally. The power of the beam was recorded with the polarizer set at ±45°. From this set of six measurements, the Stokes parameters were calculated, which yielded the parameters for the electric field polarization ellipse.
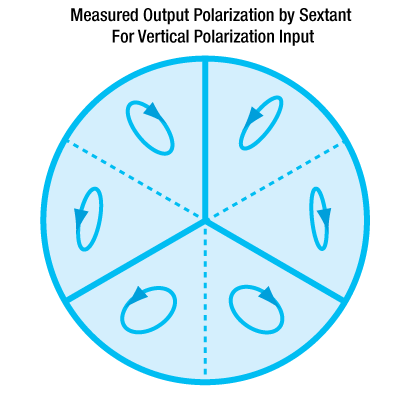
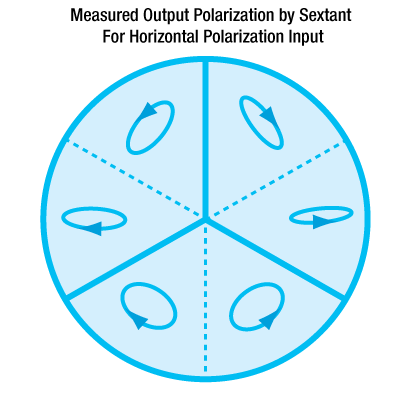
The two figures below summarize the measured results for the retroreflected polarization. The lower left figure shows the output beam by sextant for vertical input polarization; the lower right figure shows the output beam by sextant for horizontal input polarization. In both enlarged figures, A and B denote the major and minor axes respectively for the polarization ellipse. Θ is the angle between the major axis and the horizontal. Arrow heads mark the handedness of the polarization. Both Θ and handedness are reported as seen by an observer looking into the retroreflector. These measured results demonstrate that the polarization state of the retroreflected beam is dependent not only on the initial polarization of the incident beam, but also the sextant of the retroreflector that the beam in incident upon. For details on the experimental setup employed and the results summarized here, please click here.
Resources for the Interested Reader
The effects of retroreflectors on polarization state have been investigated via various methods: eigenpolarization states [2 - 4], internal incidence angles using transformations between internal reflections [5], and analytic geometry [1]. We present experimental results of polarization state changing through retroreflection and compare it to the theory developed in Ref. [1] though examination of the proper Jones and Rotation matrixes.
[1] J. Liu and R. M. A. Azzam, "Polarization properties of corner-cube retroreflectors: theory and experiment," Applied Optics 36, 1553-1559 (1997).
[2] E. R. Peck, "Polarization properties of corner reflectors and cavities," J. Opt. Soc. Am. 52, 253-257 (1962).
[3] P. Rabinowitz, S. F. Jacobs, T. Shultz, and G. Gould, "Cube-corner Fabry-Perot interferometer," J. Opt. Soc. Am. 52, 452-453 (1962).
[4] P.I Lamekin, "Intrinsic polarization states of corner reflectors," Sov. J. Opt. Tech. 54, 658-661 (1987).
[5] M. A. Acharekar, "Derivation of internal incidence angles and coordinate transformations between internal reflections for corner reflectors at normal incidence," Opt. Eng. 23, 669-674 (1984).
| N-BK7 Damage Threshold Specifications | |
|---|---|
| Coating Designation (Item # Suffix) |
Damage Threshold |
| -A | 7.5 J/cm2 at 532 nm, 10 ns, 10 Hz, Ø0.456 mm |
| -B | 7.5 J/cm2 at 810 nm, 10 ns, 10 Hz, Ø0.144 mm |
| -C | 7.5 J/cm2 at 1542 nm, 10 ns, 10 Hz, Ø0.123 mm |
Damage Threshold Data for Thorlabs' AR-Coated N-BK7 Retroreflectors
The specifications to the right are measured data for Thorlabs' AR-coated, N-BK7 Retroreflecting Prisms. Damage threshold specifications are constant for a given coating type, regardless of the size of the prism.
Laser Induced Damage Threshold Tutorial
The following is a general overview of how laser induced damage thresholds are measured and how the values may be utilized in determining the appropriateness of an optic for a given application. When choosing optics, it is important to understand the Laser Induced Damage Threshold (LIDT) of the optics being used. The LIDT for an optic greatly depends on the type of laser you are using. Continuous wave (CW) lasers typically cause damage from thermal effects (absorption either in the coating or in the substrate). Pulsed lasers, on the other hand, often strip electrons from the lattice structure of an optic before causing thermal damage. Note that the guideline presented here assumes room temperature operation and optics in new condition (i.e., within scratch-dig spec, surface free of contamination, etc.). Because dust or other particles on the surface of an optic can cause damage at lower thresholds, we recommend keeping surfaces clean and free of debris. For more information on cleaning optics, please see our Optics Cleaning tutorial.
Testing Method
Thorlabs' LIDT testing is done in compliance with ISO/DIS 11254 and ISO 21254 specifications.
First, a low-power/energy beam is directed to the optic under test. The optic is exposed in 10 locations to this laser beam for 30 seconds (CW) or for a number of pulses (pulse repetition frequency specified). After exposure, the optic is examined by a microscope (~100X magnification) for any visible damage. The number of locations that are damaged at a particular power/energy level is recorded. Next, the power/energy is either increased or decreased and the optic is exposed at 10 new locations. This process is repeated until damage is observed. The damage threshold is then assigned to be the highest power/energy that the optic can withstand without causing damage. A histogram such as that below represents the testing of one BB1-E02 mirror.
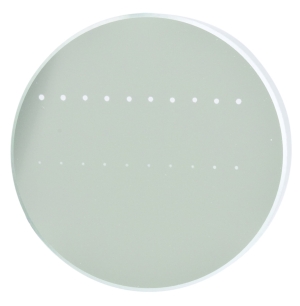
The photograph above is a protected aluminum-coated mirror after LIDT testing. In this particular test, it handled 0.43 J/cm2 (1064 nm, 10 ns pulse, 10 Hz, Ø1.000 mm) before damage.
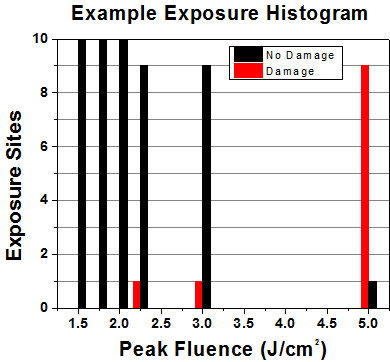
| Example Test Data | |||
|---|---|---|---|
| Fluence | # of Tested Locations | Locations with Damage | Locations Without Damage |
| 1.50 J/cm2 | 10 | 0 | 10 |
| 1.75 J/cm2 | 10 | 0 | 10 |
| 2.00 J/cm2 | 10 | 0 | 10 |
| 2.25 J/cm2 | 10 | 1 | 9 |
| 3.00 J/cm2 | 10 | 1 | 9 |
| 5.00 J/cm2 | 10 | 9 | 1 |
According to the test, the damage threshold of the mirror was 2.00 J/cm2 (532 nm, 10 ns pulse, 10 Hz, Ø0.803 mm). Please keep in mind that these tests are performed on clean optics, as dirt and contamination can significantly lower the damage threshold of a component. While the test results are only representative of one coating run, Thorlabs specifies damage threshold values that account for coating variances.
Continuous Wave and Long-Pulse Lasers
When an optic is damaged by a continuous wave (CW) laser, it is usually due to the melting of the surface as a result of absorbing the laser's energy or damage to the optical coating (antireflection) [1]. Pulsed lasers with pulse lengths longer than 1 µs can be treated as CW lasers for LIDT discussions.
When pulse lengths are between 1 ns and 1 µs, laser-induced damage can occur either because of absorption or a dielectric breakdown (therefore, a user must check both CW and pulsed LIDT). Absorption is either due to an intrinsic property of the optic or due to surface irregularities; thus LIDT values are only valid for optics meeting or exceeding the surface quality specifications given by a manufacturer. While many optics can handle high power CW lasers, cemented (e.g., achromatic doublets) or highly absorptive (e.g., ND filters) optics tend to have lower CW damage thresholds. These lower thresholds are due to absorption or scattering in the cement or metal coating.

LIDT in linear power density vs. pulse length and spot size. For long pulses to CW, linear power density becomes a constant with spot size. This graph was obtained from [1].
Pulsed lasers with high pulse repetition frequencies (PRF) may behave similarly to CW beams. Unfortunately, this is highly dependent on factors such as absorption and thermal diffusivity, so there is no reliable method for determining when a high PRF laser will damage an optic due to thermal effects. For beams with a high PRF both the average and peak powers must be compared to the equivalent CW power. Additionally, for highly transparent materials, there is little to no drop in the LIDT with increasing PRF.
In order to use the specified CW damage threshold of an optic, it is necessary to know the following:
- Wavelength of your laser
- Beam diameter of your beam (1/e2)
- Approximate intensity profile of your beam (e.g., Gaussian)
- Linear power density of your beam (total power divided by 1/e2 beam diameter)
Thorlabs expresses LIDT for CW lasers as a linear power density measured in W/cm. In this regime, the LIDT given as a linear power density can be applied to any beam diameter; one does not need to compute an adjusted LIDT to adjust for changes in spot size, as demonstrated by the graph to the right. Average linear power density can be calculated using the equation below.

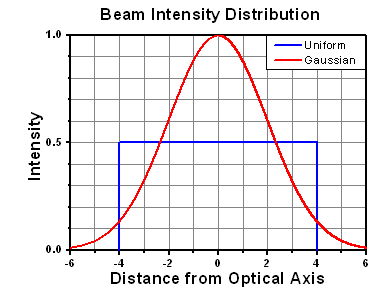
The calculation above assumes a uniform beam intensity profile. You must now consider hotspots in the beam or other non-uniform intensity profiles and roughly calculate a maximum power density. For reference, a Gaussian beam typically has a maximum power density that is twice that of the uniform beam (see lower right).
Now compare the maximum power density to that which is specified as the LIDT for the optic. If the optic was tested at a wavelength other than your operating wavelength, the damage threshold must be scaled appropriately. A good rule of thumb is that the damage threshold has a linear relationship with wavelength such that as you move to shorter wavelengths, the damage threshold decreases (i.e., a LIDT of 10 W/cm at 1310 nm scales to 5 W/cm at 655 nm):

While this rule of thumb provides a general trend, it is not a quantitative analysis of LIDT vs wavelength. In CW applications, for instance, damage scales more strongly with absorption in the coating and substrate, which does not necessarily scale well with wavelength. While the above procedure provides a good rule of thumb for LIDT values, please contact Tech Support if your wavelength is different from the specified LIDT wavelength. If your power density is less than the adjusted LIDT of the optic, then the optic should work for your application.
Please note that we have a buffer built in between the specified damage thresholds online and the tests which we have done, which accommodates variation between batches. Upon request, we can provide individual test information and a testing certificate. The damage analysis will be carried out on a similar optic (customer's optic will not be damaged). Testing may result in additional costs or lead times. Contact Tech Support for more information.
Pulsed Lasers
As previously stated, pulsed lasers typically induce a different type of damage to the optic than CW lasers. Pulsed lasers often do not heat the optic enough to damage it; instead, pulsed lasers produce strong electric fields capable of inducing dielectric breakdown in the material. Unfortunately, it can be very difficult to compare the LIDT specification of an optic to your laser. There are multiple regimes in which a pulsed laser can damage an optic and this is based on the laser's pulse length. The highlighted columns in the table below outline the relevant pulse lengths for our specified LIDT values.
Pulses shorter than 10-9 s cannot be compared to our specified LIDT values with much reliability. In this ultra-short-pulse regime various mechanics, such as multiphoton-avalanche ionization, take over as the predominate damage mechanism [2]. In contrast, pulses between 10-7 s and 10-4 s may cause damage to an optic either because of dielectric breakdown or thermal effects. This means that both CW and pulsed damage thresholds must be compared to the laser beam to determine whether the optic is suitable for your application.
| Pulse Duration | t < 10-9 s | 10-9 < t < 10-7 s | 10-7 < t < 10-4 s | t > 10-4 s |
|---|---|---|---|---|
| Damage Mechanism | Avalanche Ionization | Dielectric Breakdown | Dielectric Breakdown or Thermal | Thermal |
| Relevant Damage Specification | No Comparison (See Above) | Pulsed | Pulsed and CW | CW |
When comparing an LIDT specified for a pulsed laser to your laser, it is essential to know the following:
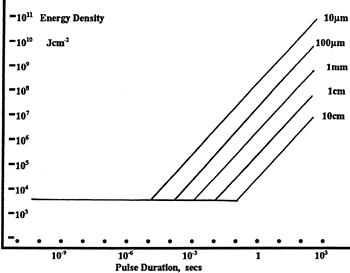
LIDT in energy density vs. pulse length and spot size. For short pulses, energy density becomes a constant with spot size. This graph was obtained from [1].
- Wavelength of your laser
- Energy density of your beam (total energy divided by 1/e2 area)
- Pulse length of your laser
- Pulse repetition frequency (prf) of your laser
- Beam diameter of your laser (1/e2 )
- Approximate intensity profile of your beam (e.g., Gaussian)
The energy density of your beam should be calculated in terms of J/cm2. The graph to the right shows why expressing the LIDT as an energy density provides the best metric for short pulse sources. In this regime, the LIDT given as an energy density can be applied to any beam diameter; one does not need to compute an adjusted LIDT to adjust for changes in spot size. This calculation assumes a uniform beam intensity profile. You must now adjust this energy density to account for hotspots or other nonuniform intensity profiles and roughly calculate a maximum energy density. For reference a Gaussian beam typically has a maximum energy density that is twice that of the 1/e2 beam.
Now compare the maximum energy density to that which is specified as the LIDT for the optic. If the optic was tested at a wavelength other than your operating wavelength, the damage threshold must be scaled appropriately [3]. A good rule of thumb is that the damage threshold has an inverse square root relationship with wavelength such that as you move to shorter wavelengths, the damage threshold decreases (i.e., a LIDT of 1 J/cm2 at 1064 nm scales to 0.7 J/cm2 at 532 nm):

You now have a wavelength-adjusted energy density, which you will use in the following step.
Beam diameter is also important to know when comparing damage thresholds. While the LIDT, when expressed in units of J/cm², scales independently of spot size; large beam sizes are more likely to illuminate a larger number of defects which can lead to greater variances in the LIDT [4]. For data presented here, a <1 mm beam size was used to measure the LIDT. For beams sizes greater than 5 mm, the LIDT (J/cm2) will not scale independently of beam diameter due to the larger size beam exposing more defects.
The pulse length must now be compensated for. The longer the pulse duration, the more energy the optic can handle. For pulse widths between 1 - 100 ns, an approximation is as follows:

Use this formula to calculate the Adjusted LIDT for an optic based on your pulse length. If your maximum energy density is less than this adjusted LIDT maximum energy density, then the optic should be suitable for your application. Keep in mind that this calculation is only used for pulses between 10-9 s and 10-7 s. For pulses between 10-7 s and 10-4 s, the CW LIDT must also be checked before deeming the optic appropriate for your application.
Please note that we have a buffer built in between the specified damage thresholds online and the tests which we have done, which accommodates variation between batches. Upon request, we can provide individual test information and a testing certificate. Contact Tech Support for more information.
[1] R. M. Wood, Optics and Laser Tech. 29, 517 (1998).
[2] Roger M. Wood, Laser-Induced Damage of Optical Materials (Institute of Physics Publishing, Philadelphia, PA, 2003).
[3] C. W. Carr et al., Phys. Rev. Lett. 91, 127402 (2003).
[4] N. Bloembergen, Appl. Opt. 12, 661 (1973).
In order to illustrate the process of determining whether a given laser system will damage an optic, a number of example calculations of laser induced damage threshold are given below. For assistance with performing similar calculations, we provide a spreadsheet calculator that can be downloaded by clicking the button to the right. To use the calculator, enter the specified LIDT value of the optic under consideration and the relevant parameters of your laser system in the green boxes. The spreadsheet will then calculate a linear power density for CW and pulsed systems, as well as an energy density value for pulsed systems. These values are used to calculate adjusted, scaled LIDT values for the optics based on accepted scaling laws. This calculator assumes a Gaussian beam profile, so a correction factor must be introduced for other beam shapes (uniform, etc.). The LIDT scaling laws are determined from empirical relationships; their accuracy is not guaranteed. Remember that absorption by optics or coatings can significantly reduce LIDT in some spectral regions. These LIDT values are not valid for ultrashort pulses less than one nanosecond in duration.

A Gaussian beam profile has about twice the maximum intensity of a uniform beam profile.
CW Laser Example
Suppose that a CW laser system at 1319 nm produces a 0.5 W Gaussian beam that has a 1/e2 diameter of 10 mm. A naive calculation of the average linear power density of this beam would yield a value of 0.5 W/cm, given by the total power divided by the beam diameter:

However, the maximum power density of a Gaussian beam is about twice the maximum power density of a uniform beam, as shown in the graph to the right. Therefore, a more accurate determination of the maximum linear power density of the system is 1 W/cm.
An AC127-030-C achromatic doublet lens has a specified CW LIDT of 350 W/cm, as tested at 1550 nm. CW damage threshold values typically scale directly with the wavelength of the laser source, so this yields an adjusted LIDT value:

The adjusted LIDT value of 350 W/cm x (1319 nm / 1550 nm) = 298 W/cm is significantly higher than the calculated maximum linear power density of the laser system, so it would be safe to use this doublet lens for this application.
Pulsed Nanosecond Laser Example: Scaling for Different Pulse Durations
Suppose that a pulsed Nd:YAG laser system is frequency tripled to produce a 10 Hz output, consisting of 2 ns output pulses at 355 nm, each with 1 J of energy, in a Gaussian beam with a 1.9 cm beam diameter (1/e2). The average energy density of each pulse is found by dividing the pulse energy by the beam area:

As described above, the maximum energy density of a Gaussian beam is about twice the average energy density. So, the maximum energy density of this beam is ~0.7 J/cm2.
The energy density of the beam can be compared to the LIDT values of 1 J/cm2 and 3.5 J/cm2 for a BB1-E01 broadband dielectric mirror and an NB1-K08 Nd:YAG laser line mirror, respectively. Both of these LIDT values, while measured at 355 nm, were determined with a 10 ns pulsed laser at 10 Hz. Therefore, an adjustment must be applied for the shorter pulse duration of the system under consideration. As described on the previous tab, LIDT values in the nanosecond pulse regime scale with the square root of the laser pulse duration:

This adjustment factor results in LIDT values of 0.45 J/cm2 for the BB1-E01 broadband mirror and 1.6 J/cm2 for the Nd:YAG laser line mirror, which are to be compared with the 0.7 J/cm2 maximum energy density of the beam. While the broadband mirror would likely be damaged by the laser, the more specialized laser line mirror is appropriate for use with this system.
Pulsed Nanosecond Laser Example: Scaling for Different Wavelengths
Suppose that a pulsed laser system emits 10 ns pulses at 2.5 Hz, each with 100 mJ of energy at 1064 nm in a 16 mm diameter beam (1/e2) that must be attenuated with a neutral density filter. For a Gaussian output, these specifications result in a maximum energy density of 0.1 J/cm2. The damage threshold of an NDUV10A Ø25 mm, OD 1.0, reflective neutral density filter is 0.05 J/cm2 for 10 ns pulses at 355 nm, while the damage threshold of the similar NE10A absorptive filter is 10 J/cm2 for 10 ns pulses at 532 nm. As described on the previous tab, the LIDT value of an optic scales with the square root of the wavelength in the nanosecond pulse regime:

This scaling gives adjusted LIDT values of 0.08 J/cm2 for the reflective filter and 14 J/cm2 for the absorptive filter. In this case, the absorptive filter is the best choice in order to avoid optical damage.
Pulsed Microsecond Laser Example
Consider a laser system that produces 1 µs pulses, each containing 150 µJ of energy at a repetition rate of 50 kHz, resulting in a relatively high duty cycle of 5%. This system falls somewhere between the regimes of CW and pulsed laser induced damage, and could potentially damage an optic by mechanisms associated with either regime. As a result, both CW and pulsed LIDT values must be compared to the properties of the laser system to ensure safe operation.
If this relatively long-pulse laser emits a Gaussian 12.7 mm diameter beam (1/e2) at 980 nm, then the resulting output has a linear power density of 5.9 W/cm and an energy density of 1.2 x 10⁻⁴ J/cm2 per pulse. This can be compared to the LIDT values for a WPQ10E-980 polymer zero-order quarter-wave plate, which are 5 W/cm for CW radiation at 810 nm and 5 J/cm2 for a 10 ns pulse at 810 nm. As before, the CW LIDT of the optic scales linearly with the laser wavelength, resulting in an adjusted CW value of 6 W/cm at 980 nm. On the other hand, the pulsed LIDT scales with the square root of the laser wavelength and the square root of the pulse duration, resulting in an adjusted value of 55 J/cm2 for a 1 µs pulse at 980 nm. The pulsed LIDT of the optic is significantly greater than the energy density of the laser pulse, so individual pulses will not damage the wave plate. However, the large average linear power density of the laser system may cause thermal damage to the optic, much like a high-power CW beam.
Insights into Retroreflectors
Scroll down to read about interactions between light and corner-cube retroreflectors.
- How does alignment affect the beam path through a retroreflector?
- Why coat the backsides of solid prism retroreflectors with metal?
- Does the angle of incidence affect the output beam power from a corner-cube retroreflector?
Click here for more insights into lab practices and equipment.
How does alignment affect the beam path through a retroreflector?
Click to Enlarge
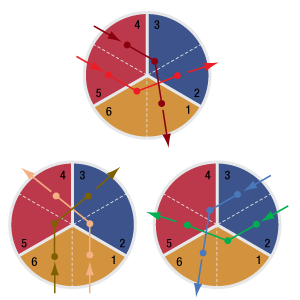
Figure 2: There are six possible sequences of reflections for a beam. The zone in which the first reflection occurs determines the sequence. These maps apply to beams approximately parallel with the retroreflector's normal axis. The beam paths are indicated by arrows, and dots mark reflections.
Click to Enlarge
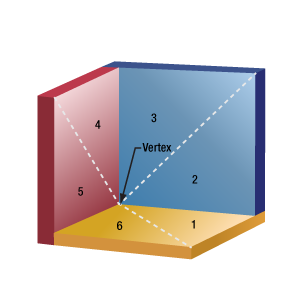
Figure 1: The three reflective faces of a corner-cube retroreflector are shown in false color and with numerical labels assigned to each half. Retroreflectors are designed to reflect an incident beam once from each face and provide an output beam parallel to the input.
Click to Enlarge
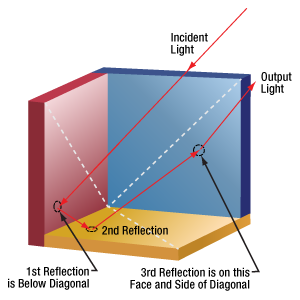
Figure 4: Shifting the position of the first reflection to below the diagonal of the red face causes the next reflection to occur from the yellow face. After the third reflection, from the blue face, the beam exits the retroreflector travelling parallel to but shifted from the output beam in Figure 3.
Click to Enlarge
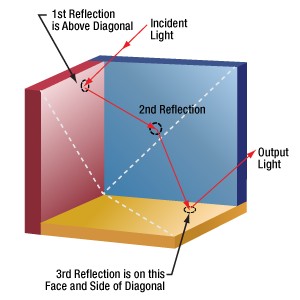
Figure 3: When the first reflection occurs above the diagonal of the red face, and the beam is parallel to the retroreflector's normal axis, the second reflection occurs from the blue face. The beam then reflects from the yellow face before exiting the retroreflector.
Beams output from corner-cube retroreflectors travel parallel to the input beam, but in the opposite direction. The input beam can be aligned to the vertex or to a point on one of the three faces. The input and output beams are colinear if the input beam is aligned to the vertex. The two beams will be separated if the input beam spot does not overlap the vertex.
Input beams aligned to one of the retroreflector's faces will reflect from that face and then the other two before exiting the retroreflector. For a range of incident angles, there are six possibilities for the order in which the beam will reflect from the three different faces. lt can be useful to select the path through the retroreflector for reasons that include optimal beam positioning and minimizing polarization effects.
For a beam to follow a particular sequence of reflections, it is not sufficient to align the beam so that it is incident on a specific face. The beam must also be incident on the proper half of that face.
Tracing the Beam Path
When looking into the vertex of the retroreflector, reflective effects make it possible to see the six halves of the three faces. Here, they are identified using dashed diagonal lines (Figure 1). In addition, the three faces of the retroreflector are shaded with false color for illustrative purposes. The normal axis is not shown, but it passes through the vertex and is equidistant from all three faces.
The six different possible reflection sequences can vary with angle of incidence. The maps in Figure 2 apply to beams nearly parallel with the normal axis. While a hollow retroreflector is used for these illustrations, these sequences of reflections also apply to prism retroreflecting mirrors.
The position of the first reflection determines which sequence of reflections the beam will follow through the retroreflector. The beam always exits from a different face than it entered.
Example
Figures 3 and 4 illustrate the two orders of reflections that can occur when the first reflection occurs from the left-most vertical face. The incident beam is parallel to the retroreflector's normal axis.
When the first reflection occurs above the diagonal, as shown in Figure 3, the last reflection occurs from the horizontal (yellow) mirror. However, locating the first reflection below the diagonal results in a last reflection from the other vertical (blue) mirror. The output beams of these two cases are parallel to, but shifted from, one another.
Date of Last Edit: July 8, 2020
Why coat the backsides of solid prism retroreflectors with metal?
Click to Enlarge
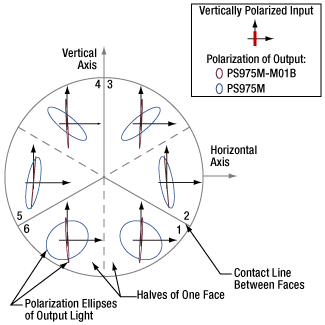
Figure 6: Vertically polarized beams were input to a TIR solid prism retroreflector (PS975M) and a backside-gold-coated solid prism retroreflector (PS975M-M01B). The polarization ellipse of each output beam is shown in the zone that provided the beam's third reflection. For a plot of the ellipticity angle ( χ ) and orientation angles ( ψ ) with respect to the horizontal axis, click here.
Click to Enlarge
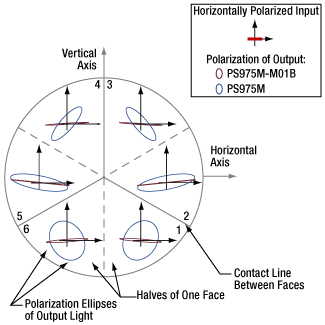
Figure 5: Horizontally polarized beams were input to a TIR solid prism retroreflector (PS975M) and a backside-gold-coated solid prism retroreflector (PS975M-M01B). The polarization ellipse of each output beam is shown in the zone that provided the beam's third reflection. For a plot of the ellipticity angles ( ψ ) with respect to the horizontal axis, click here.
Click to Enlarge
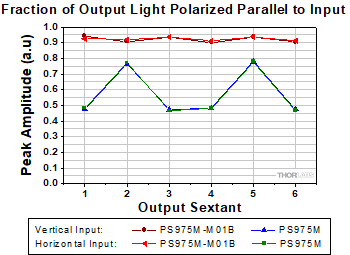
Figure 8: Retroreflectors convert some of the input light to the orthogonal polarization. Over 90% of the light output from the backside-gold-coated solid prism retroreflector (PS975M-M01B) remained polarized in the input state. In the case of the TIR solid prism retroreflector (PS975M), that percentage strongly depended on beam path and did not exceed 80%.

Click to Enlarge
Figure 7: A retroreflector is designed to reflect an input beam once off of each face. When the beam is approximately normal to the viewing plane illustrated in Figures 5 and 6, the beam will follow one of six beam paths.
When the backsides of solid prism retroreflectors are coated with metal, polarization changes induced in the output beam are significantly reduced.
This is due to the difference between specular reflections, which occur from interfaces between glass and the higher refractive index metal, and reflections that occur due to total internal reflection (TIR), which require the backside material, like air, to have a lower refractive index.
Compared with TIR, a specular reflection from a glass-metal interface better preserves the input beam's polarization ellipticity.
Polarization and Beam Path Diagrams
Beam paths through a retroreflector can be described by dividing its three reflective faces into six wedge-shaped zones (Figures 5, 6 and 7). Solid gray boundary lines mark physical lines of contact between reflective faces. Dotted gray lines indicate boundaries between the halves of each face.
The retroreflectors in these figures are oriented with one face-to-face interface aligned with the vertical axis. When the input beam is normal to these figures' viewing planes, Figure 7 describes the order in which the input beam reflects from the three faces before being output.
Output Polarization State
Two sets of six measurements were made for both a PS975M TIR solid prism retroreflector and a
In Figures 5 and 6, the polarization states of the output beam are represented using polarization ellipses. Each output beam's polarization ellipse is shown in the zone that provided the third reflection.
Ideally, the output beam would have the same polarization state as the input beam. However, these measurements indicate the retroreflectors converted some of the incident light to the orthogonal polarization. The plot in Figure 8 is a measure of the fraction of light in the output beam that was polarized parallel to the input.
The backside-gold-coated solid prism retroreflector was significantly more successful in maintaining the polarization state of these linearly polarized input beams.
Date of Last Edit: July 7, 2020
Does the angle of incidence affect the output beam power from a corner-cube retroreflector?
Click to Enlarge
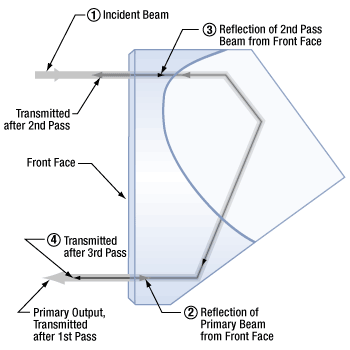
Figure 10: Since the refractive indices of glass and air are different, the beam reflects at the front face. Reflected light can make multiple passes through the retroreflector before being output. Coherent overlapping beams produce interference effects.
Click to Enlarge
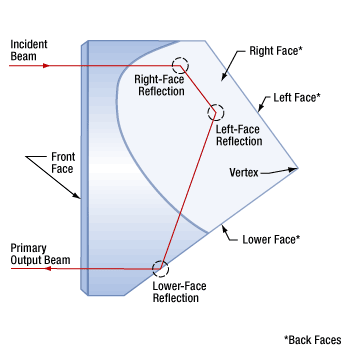
Figure 9: The beam path through a corner-cube retroreflector includes a reflection from each of the three back faces, in an order determined by the position of the incident beam. The incident beam shown above has a 0° AOI and is displaced from the vertex.
Click to Enlarge
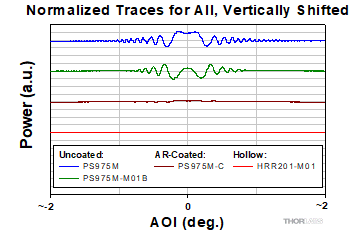
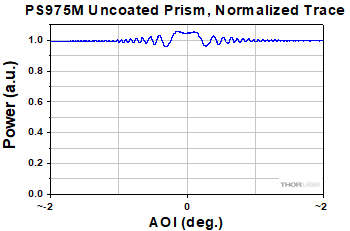
Figure 12: Output power as a function of AOI differed depending on the type of corner-cube retroreflector. Data from measurements, made as described in Figure 11, were normalized to the same scale, and traces were vertically shifted as a visual aid. Oscillation amplitude was strongly suppressed when the front face was AR-coated
Click to Enlarge
Figure 11: The power output by a TIR solid prism retroreflector (PS975M) was measured as a function of AOI. The incident beam was provided by a DBR1064S 1064 nm laser source, whose coherence length was several meters. The largest-amplitude oscillations resulted around 0° AOI, where the first- and third-pass beams overlapped. The 1/e2 beam diameters did not overlap for AOIs larger than ±1° at a distance of 30 cm from the front face of the retroreflector.
The beam power output by solid prism retroreflectors may oscillate around an average value as the angle of incidence (AOI) varies. This is due to a multiple-beam interference effect that can occur when the coherence length of the light source is at least twice the optical path length through the retroreflector.
When the front face of a solid retroreflector has an anti-reflective coating, oscillation amplitudes for all AOIs are substantially reduced. Hollow metal-coated retroreflectors provide output beams whose power is approximately independent of AOI.
Beam Path
These corner-cube retroreflectors provide an output beam that travels in a direction parallel and opposite to the incident beam. Figure 9 shows one
The AOI is determined using a reference axis normal to the front face of the retroreflector. This axis passes through the vertex and is equidistant from the three back faces.
Reflections from the Front Face
As illustrated in Figure 10, light can make multiple passes through a solid prism retroreflector, depending on whether the light reflects from or is transmitted through interfaces between the front face and the surrounding medium.
When a glass retroreflector is surrounded by air, ~96% of the light is in the primary output beam, which makes a single pass through the retroreflector, and ~0.16% is in the beam that completes an additional round trip. In this work, light making additional round trips had negligible intensity.
Conditions for Interference
Since the output of solid prism retroreflectors consists of beams that have travelled different optical path lengths, they will interfere if:
- The beams overlap, which is more likely when the AOI of the incident beam is near 0° and the output is measured closer to the retroreflector. At larger distances, the beam deviation specified for the retroreflector and the AOI will more widely separate the first- and third-pass beams.
- The coherence length of the source is longer than the difference in path length between the primary beam and the overlapping beam that has made more than one pass through the retroreflector.
Corner-Cube Retroreflectors Compared
The variation of output power with small AOI was compared for four different types of corner-cube retroreflectors: a PS975M TIR solid prism retroreflector, a
Figure 11 plots the normalized measurements made for the TIR solid prism retroreflector. As the AOI increased, the centers of the first- and third-pass beams shifted away from one another. At AOIs greater than around ±1°, the beams' 1/e2 diameters no longer overlapped. This resulted in the oscillation amplitude decreasing with AOI. The range of AOIs over which oscillations were significant would increase if the detector were located closer to the front face.
Figure 12 plots the trace from Figure 11, as well as traces measured for the other three retroreflectors, on the same scale but vertically shifted as a visual aid. These results indicate that an antireflective-coated front face suppresses power oscillations in beams output by solid prism retroreflectors. The power output by hollow retroreflectors does not oscillate, since there is no material boundary at the front face.
Date of Last Edit: July 7, 2020
Selection Guide for Prisms
Thorlabs offers a wide variety of prisms, which can be used to reflect, invert, rotate, disperse, steer, and collimate light. For prisms and substrates not listed below, please contact Tech Support.
Beam Steering Prisms
| Prism | Material | Deviation | Invert | Reverse or Rotate | Illustration | Applications |
|---|---|---|---|---|---|---|
| Right Angle Prisms | N-BK7, UV Fused Silica, Calcium Fluoride, or Zinc Selenide | 90° | 90° | No | 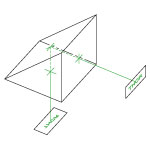 |
90° reflector used in optical systems such as telescopes and periscopes. |
| 180° | 180° | No | 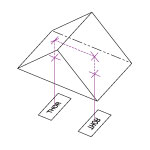 |
180° reflector, independent of entrance beam angle. Acts as a non-reversing mirror and can be used in binocular configurations. |
||
| TIR Retroreflectors (Unmounted and Mounted) and Specular Retroreflectors (Unmounted and Mounted) |
N-BK7 | 180° | 180° | No | 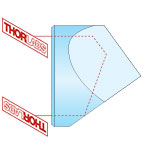 |
180° reflector, independent of entrance beam angle. Beam alignment and beam delivery. Substitute for mirror in applications where orientation is difficult to control. |
| Unmounted Penta Prisms and Mounted Penta Prisms |
N-BK7 | 90° | No | No | 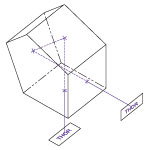 |
90° reflector, without inversion or reversal of the beam profile. Can be used for alignment and optical tooling. |
| Roof Prisms | N-BK7 | 90° | 90° | 180o Rotation | 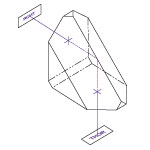 |
90° reflector, inverted and rotated (deflected left to right and top to bottom). Can be used for alignment and optical tooling. |
| Unmounted Dove Prisms and Mounted Dove Prisms |
N-BK7 | No | 180° | 2x Prism Rotation | 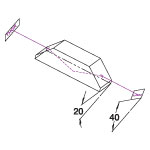 |
Dove prisms may invert, reverse, or rotate an image based on which face the light is incident on. Prism in a beam rotator orientation. |
| 180° | 180° | No | 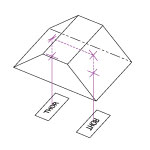 |
Prism acts as a non-reversing mirror. Same properties as a retroreflector or right angle (180° orientation) prism in an optical setup. |
||
| Wedge Prisms | N-BK7 | Models Available from 2° to 10° | No | No |  |
Beam steering applications. By rotating one wedged prism, light can be steered to trace the circle defined by 2 times the specified deviation angle. |
| No | No |  |
Variable beam steering applications. When both wedges are rotated, the beam can be moved anywhere within the circle defined by 4 times the specified deviation angle. |
|||
| Coupling Prisms | Rutile (TiO2) or GGG | Variablea | No | No | 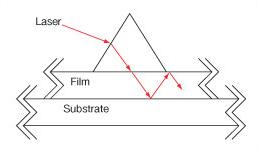 |
High index of refraction substrate used to couple light into films. Rutile used for nfilm > 1.8 GGG used for nfilm < 1.8 |
Dispersive Prisms
| Prism | Material | Deviation | Invert | Reverse or Rotate | Illustration | Applications |
|---|---|---|---|---|---|---|
| Equilateral Prisms | F2, N-F2, N-SF11, Calcium Fluoride, or Zinc Selenide |
Variablea | No | No | 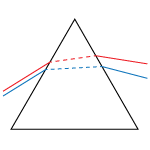 |
Dispersion prisms are a substitute for diffraction gratings. Use to separate white light into visible spectrum. |
| Dispersion Compensating Prism Pairs | Fused Silica, Calcium Fluoride, SF10, or N-SF14 | Variable Vertical Offset | No | No |  |
Compensate for pulse broadening effects in ultrafast laser systems. Can be used as an optical filter, for wavelength tuning, or dispersion compensation.
|
| Pellin Broca Prisms | N-BK7, UV Fused Silica, or Calcium Fluoride |
90° | 90° | No | 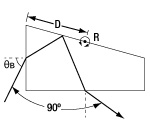 |
Ideal for wavelength separation of a beam of light, output at 90°. Used to separate harmonics of a laser or compensate for group velocity dispersion. |
Beam Manipulating Prisms
| Prism | Material | Deviation | Invert | Reverse or Rotate | Illustration | Applications |
|---|---|---|---|---|---|---|
| Anamorphic Prism Pairs | N-KZFS8 or N-SF11 |
Variable Vertical Offset | No | No | 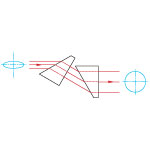 |
Variable magnification along one axis. Collimating elliptical beams (e.g., laser diodes) Converts an elliptical beam into a circular beam by magnifying or contracting the input beam in one axis. |
| Axicons (UVFS, ZnSe) | UV Fused Silica or Zinc Selenide |
Variablea | No | No |
Creates a conical, non-diverging beam with a Bessel intensity profile from a collimated source. |
Polarization Altering Prisms
| Prism | Material | Deviation | Invert | Reverse or Rotate | Illustration | Applications |
|---|---|---|---|---|---|---|
| Glan-Taylor, Glan-Laser, and α-BBO Glan-Laser Polarizers | Glan-Taylor: Calcite Glan-Laser: α-BBO or Calcite |
p-pol. - 0° s-pol. - 112°a |
No | No | 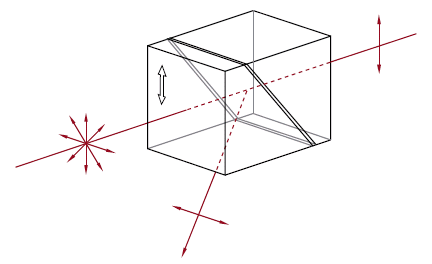 |
Double prism configuration and birefringent calcite produce extremely pure linearly polarized light. Total Internal Reflection of s-pol. at the gap between the prism while p-pol. is transmitted. |
| Rutile Polarizers | Rutile (TiO2) | s-pol. - 0° p-pol. absorbed by housing |
No | No | 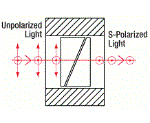 |
Double prism configuration and birefringent rutile (TiO2) produce extremely pure linearly polarized light. Total Internal Reflection of p-pol. at the gap between the prisms while s-pol. is transmitted.
|
| Double Glan-Taylor Polarizers | Calcite | p-pol. - 0° s-pol. absorbed by housing |
No | No | 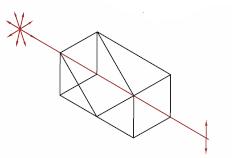 |
Triple prism configuration and birefringent calcite produce maximum polarized field over a large half angle. Total Internal Reflection of s-pol. at the gap between the prism while p-pol. is transmitted. |
| Glan Thompson Polarizers | Calcite | p-pol. - 0° s-pol. absorbed by housing |
No | No |  |
Double prism configuration and birefringent calcite produce a polarizer with the widest field of view while maintaining a high extinction ratio. Total Internal Reflection of s-pol. at the gap between the prism while p-pol. is transmitted. |
| Wollaston Prisms and Wollaston Polarizers |
Quartz, Magnesium Fluoride, α-BBO, Calcite, Yttrium Orthovanadate | Symmetric p-pol. and s-pol. deviation angle |
No | No | 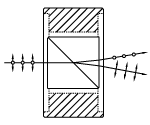 |
Double prism configuration and birefringent calcite produce the widest deviation angle of beam displacing polarizers. s-pol. and p-pol. deviate symmetrically from the prism. Wollaston prisms are used in spectrometers and polarization analyzers. |
| Rochon Prisms | Magnesium Fluoride or Yttrium Orthovanadate |
Ordinary Ray: 0° Extraordinary Ray: deviation angle |
No | No |  |
Double prism configuration and birefringent MgF2 or YVO4 produce a small deviation angle with a high extinction ratio. Extraordinary ray deviates from the input beam's optical axis, while ordinary ray does not deviate. |
| Beam Displacing Prisms | Calcite | 2.7 or 4.0 mm Beam Displacement | No | No | 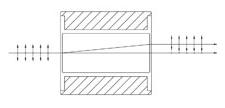 |
Single prism configuration and birefringent calcite separate an input beam into two orthogonally polarized output beams. s-pol. and p-pol. are displaced by 2.7 or 4.0 mm. Beam displacing prisms can be used as polarizing beamsplitters where 90o separation is not possible. |
| Fresnel Rhomb Retarders | N-BK7 | Linear to circular polarization Vertical Offset |
No | No | 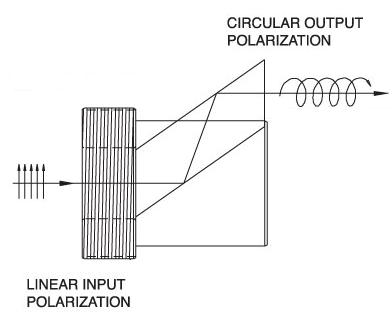 |
λ/4 Fresnel Rhomb Retarder turns a linear input into circularly polarized output. Uniform λ/4 retardance over a wider wavelength range compared to birefringent wave plates. |
| Rotates linearly polarized light 90° | No | No |  |
λ/2 Fresnel Rhomb Retarder rotates linearly polarized light 90°. Uniform λ/2 retardance over a wider wavelength range compared to birefringent wave plates. |
Beamsplitter Prisms
| Prism | Material | Deviation | Invert | Reverse or Rotate | Illustration | Applications |
|---|---|---|---|---|---|---|
| Beamsplitter Cubes | N-BK7 | 50:50 splitting ratio, 0° and 90° s- and p- pol. within 10% of each other |
No | No | 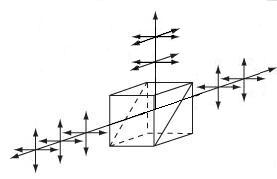 |
Double prism configuration and dielectric coating provide 50:50 beamsplitting nearly independent of polarization. Non-polarizing beamsplitter over the specified wavelength range. |
| Polarizing Beamsplitter Cubes | N-BK7, UV Fused Silica, or N-SF1 | p-pol. - 0° s-pol. - 90° |
No | No | 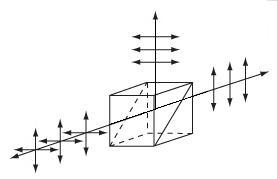 |
Double prism configuration and dielectric coating transmit p-pol. light and reflect s-pol. light. For highest polarization use the transmitted beam. |
| Posted Comments: | |
olivier.hignette
(posted 2018-11-26 11:20:52.393) How concentric is the outer diameter with respect to the projection of the apex on the entrance face ?
Regards
Olivier nbayconich
(posted 2018-12-05 01:22:06.0) Thank you for contacting Thorlabs. We do not specify the concentricity of the apex reletive to the input aperture of these retroreflectors however the typical tolerance of the angled surfaces are 35° 16' ±3 arc seconds. vignesh.vijay1712
(posted 2017-07-22 18:22:22.1) I decided to my project has an retro reflector. And I want to know about the reflector prism it has been a light passing through the prism and inside an prism a object has been placed, in between this light passing prism the object has be invisible and may I want to know about the prism? tfrisch
(posted 2017-07-26 11:23:32.0) Hello, thank you for contacting Thorlabs. I will reach out to you directly about your application. user
(posted 2013-09-18 13:05:47.12) http://www.thorlabs.de/newgrouppage9.cfm?objectgroup_id=145
Lab Facts
Link "HRS014 stabilized HeNe laser" should probably be HRS015 sharrell
(posted 2013-09-18 08:43:00.0) Response from Sean at Thorlabs: Thank you for pointing out the error. You are correct that the link should be HRS015 and we have corrected it. mathieu.perrin
(posted 2013-06-22 16:25:07.713) Hello,
+1 for the suggestion of gholtom to make hollow retroreflectors and rooftop mirrors for femtosecond experiments. Indeed, they are insensitive to delay line pitch and yaw deviations (like other retroreflectors), AND they don't add unwanted group delay dispersion. -- Regards, M. Perrin. tcohen
(posted 2013-07-11 16:26:00.0) Response from Tim at Thorlabs: Thank you for your suggestion! We are engineering new retroreflectors and hollow retroreflectors are an active project. I will contact you to keep you updated. gholtom
(posted 2010-12-01 08:56:48.0) Would you be interested in making a reflective corner cube and Porro prism? I use ultrafast lasers and can not tolerate the large amount of glass. An aluminum machined piece for face-mounting three (two for Porro) 1 inch diameter mirrors would work well. A spring clip on the back could hold the mirrors in place.
Please let me know if you are interested in making such a device, or have a question about what I would like. Thorlabs
(posted 2010-10-11 18:19:43.0) Response from Javier at Thorlabs to e.dehghan: we do offer dovetail prisms. Please visit the following link: http://www.thorlabs.com/NewGroupPage9.cfm?ObjectGroup_ID=146 e.dehghan
(posted 2010-10-11 07:18:59.0) I need Dove Prism and lens for produsing Refractometer.
is there any related item in your products.
thnks alot.
Ebrahim Dehghan klee
(posted 2009-08-07 09:53:12.0) A response from Ken at Thorlabs to rajiv: Please send your drawings to techsupport@thorlabs.com and we will review them and let you know if we will be able to quote. rajiv
(posted 2009-08-06 23:44:38.0) we are interested in corner cube retroreflectors manufactured to our drawings and using specified material. pls let us know how we can proceed |

| Item # | Wavelength Range | Transmission | Surface Flatness | Clear Aperture | Length (L)a | Diameter (D)a | Max Beam Diameterb |
Reference Diagram |
|---|---|---|---|---|---|---|---|---|
| PS974 | 350 - 2000 nm | Click for Raw Data |
λ/10 @ 633 nm | Ø7.0 mm | 9.0 mm | Ø10.0 mm | Ø0.13" (3.302 mm) | |
| PS977 | <λ/10 @ 633 nm | >Ø8.9 mm | 11.4 mm | Ø12.7 mm | Ø0.16" (4.085 mm) | |||
| PS975 | λ/10 @ 633 nm | Ø17.8 mm | 22.0 mm | Ø25.4 mm | Ø0.32" (8.125 mm) | |||
| PS976 | λ/10 @ 633 nm | Ø35.0 mm | 42.0 mm | Ø50.0 mm | Ø0.64" (16.256 mm) |

| Item # | Wavelength Range | AR Coating Range | Surface Flatness | Clear Aperture | Damage Threshold | Length (L)a | Diameter (D)a | Max Beam Diameterb |
Reference Diagram |
|---|---|---|---|---|---|---|---|---|---|
| PS974-A | 350 - 700 nm | Click for Raw Data |
λ/10 @ 633 nm | Ø7.0 mm | 7.5 J/cm2 at 532 nm, 10 ns, 10 Hz, Ø0.456 mm |
9.0 mm | Ø10.0 mm | Ø0.13" (3.302 mm) | |
| PS977-A | <λ/10 @ 633 nm | >Ø8.9 mm | 11.4 mm | Ø12.7 mm | Ø0.16" (4.085 mm) | ||||
| PS975-A | λ/10 @ 633 nm | Ø17.8 mm | 22.0 mm | Ø25.4 mm | Ø0.32" (8.125 mm) | ||||
| PS976-A | λ/10 @ 633 nm | Ø35.0 mm | 42.0 mm | Ø50.0 mm | Ø0.64" (16.256 mm) |

| Item # | Wavelength Range | AR Coating Range | Surface Flatness | Clear Aperture | Damage Threshold | Length (L)a | Diameter (D)a | Max Beam Diameterb |
Reference Diagram |
|---|---|---|---|---|---|---|---|---|---|
| PS974-B | 650 - 1050 nm | Click for Raw Data |
λ/10 @ 633 nm | Ø7.0 mm | 7.5 J/cm2 at 810 nm, 10 ns, 10 Hz, Ø0.144 mm |
9.0 mm | Ø10.0 mm | Ø0.13" (3.302 mm) | |
| PS977-B | <λ/10 @ 633 nm | >Ø8.9 mm | 11.4 mm | Ø12.7 mm | Ø0.16" (4.085 mm) | ||||
| PS975-B | λ/10 @ 633 nm | Ø17.8 mm | 22.0 mm | Ø25.4 mm | Ø0.32" (8.125 mm) | ||||
| PS976-B | λ/10 @ 633 nm | Ø35.0 mm | 42.0 mm | Ø50.0 mm | Ø0.64" (16.256 mm) |

| Item # | Wavelength Range | AR Coating Range | Surface Flatness | Clear Aperture | Damage Threshold | Length (L)a | Diameter (D)a | Max Beam Diameterb |
Reference Diagram |
|---|---|---|---|---|---|---|---|---|---|
| PS974-C | 1050 - 1700 nm | Click for Raw Data |
λ/10 @ 633 nm | Ø7.0 mm | 7.5 J/cm2 at 1542 nm, 10 ns, 10 Hz, Ø0.123 mm |
9.0 mm | Ø10.0 mm | Ø0.13" (3.302 mm) | |
| PS977-C | <λ/10 @ 633 nm | >Ø8.9 mm | 11.4 mm | Ø12.7 mm | Ø0.16" (4.085 mm) | ||||
| PS975-C | λ/10 @ 633 nm | Ø17.8 mm | 22.0 mm | Ø25.4 mm | Ø0.32" (8.125 mm) | ||||
| PS976-C | λ/10 @ 633 nm | Ø35.0 mm | 42.0 mm | Ø50.0 mm | Ø0.64" (16.256 mm) |
 Products Home






 Unmounted Retroreflector Prisms, TIR