 Products Home / Lasers / Coherent Sources / Femtosecond Lasers / Microscope Slide Peak Power Sensor for Two-Photon Lasers
Microscope Slide Peak Power Sensor for Two-Photon Lasers
- Measure Relative Peak Power of Two-Photon Lasers
- Compatible with Microscope Stages for Measurements at the Sample
- Designed to Optimize Pulses for Multiphoton Imaging
- Compatible with Dry, Water Immersion, and Oil Immersion Objectives
NS170C
Microscope Slide Peak Power Sensor for Two-Photon Lasers, 780 - 1300 nm
NS170C Microscope Slide Peak Power Sensor Used with a Prelude® Imaging Microscope and TL10X-2P Objective


Please Wait
| Key Specifications | |
|---|---|
| Detector Type | Second-Order Nonlinear Crystal with Silicon Photodiode |
| Laser Wavelength Range | 780 - 1300 nm |
| SHG Wavelength Range | 390 - 650 nm |
| Max Peak Power Densitya | 10 TW/cm2 |
| Laser Average Power Rangeb | 0.5 - 350 mW |
| SHG Optical Power Working Range | 10 nW - 5 mW |
| Resolutionc | 1 nW |
(See Applications Tab for Details)
Features
- Designed to Measure Relative Peak Power of Two-Photon Lasers
- Nonlinear Crystal Enables Direct Measurement of the Laser's Second Harmonic
- Laser Wavelength Range: 780 - 1300 nm
- Second-Harmonic Wavelength Range: 390 - 650 nm
- Footprint Enables Peak Power Optimization at the Sample Plane
- Compatible with Dry, Water Immersion, and Oil Immersion Objectives
- Compatible with Thorlabs' Power Meter Consoles (Sold Below)
Applications
- Optimize Group Delay Dispersion of Femtosecond Lasers at the Focus of a Two-Photon Microscope
- Ensure Laser Conditions are Consistent Between Experiments
- Quickly Evaluate the Quality of Femtosecond Laser Pulses
Thorlabs' Microscope Slide Peak Power Sensor is designed to measure the relative peak power of two-photon lasers. It shares the same physical dimensions as a microscope slide, enabling measurements of the relative peak power at the focus of a microscope and making the sensor ideal for laser pulse optimization for multiphoton microscopy (see the Applications tab for details).
The NS170C sensor utilizes a second-order nonlinear β-BBO (beta-BaB2O4) crystal to convert incident ultrafast near-infrared (NIR) pulses into their visible second harmonic. Because the efficiency of second harmonic generation (SHG) is proportional to the peak power density, or peak intensity, of the NIR femtosecond pulses, the magnitude of the detected second harmonic light provides a relative measurement of the peak power of the laser. Please see the Optical Design and Operation tabs for more details.
The NS170C sensor is compatible with microscope slide holders of standard upright and inverted microscopes. As illustrated in the animation to the right, the sensor can be used to measure the relative peak power at the focus of a microscope. This allows the user to optimize the laser pulse duration directly at the sample plane for high image contrast (see the Applications tab for details). The sensor is also post-mountable via an 8-32 (M4 x 0.7) tapped hole, allowing for the relative peak power to be measured in an optical set-up of standard optomechanical components.
The housing of the NS170C sensor features a knurled adjustment wheel to tune the angle between the light's polarization orientation and the β-BBO crystal's optical axis. At the entrance of the sensor is a 170 µm thick cover glass sealed to the sensor housing, allowing the sensor to be used with dry, water immersion, and oil immersion objectives. The working distance from the top of the cover glass to the β-BBO crystal is 0.22 mm. The bottom of the sensor housing features a laser-engraved alignment crosshair that marks the active sensor area to aid in aligning and focusing the beam. To use, insert the housing into the beam path such that the engraved side is facing the objective of your microscope. Once the beam is centered on the engraved target, simply turn the sensor over so that the detector is facing the beam in order to take a power measurement.
Second Harmonic Generation
The efficiency of SHG is dependent on the peak power density of incident laser pulses. Once the sensor is positioned at the focal plane of the microscope objective, the effective focal area becomes fixed and the SHG signal is only dependent on peak power. For a given average laser power and repetition rate, the peak power is only dependent on the pulse duration. Therefore, changes to the pulse duration results in a clear metered readout of the SHG power, allowing for optimization of laser pulses directly at the sample plane. Please see the Operation tab for a detailed description of how these parameters impact the SHG conversion efficiency.
 Click to Enlarge
The NS170C sensor features a knurled phase adjustment wheel to tune the rotational orientation of the β-BBO crystal.
Power Meter Console and Interface Compatibility
The NS170C sensor is compatible with the PM100D, PM100A, PM400, and PM5020 power meter consoles, as well as many of our C-series power and energy meter interfaces, which provide communication between the sensor and an external control unit such as a PC. A 1.5 m cable attached to the side of the sensor head leads to a D-sub 9-pin male connector. Nonvolatile memory in the sensor connector contains sensor information data and the NIST- and PTB- traceable calibration data. Please note that the NIST and PTB calibration is for the visible light incident on the detector; however, the magnitude of that visible light is specific to the illumination conditions of the NIR femtosecond pulses. Please see the Applications tab for more details.
When using the NS170C sensor with our power meter consoles and interfaces, please use the NIR input laser wavelength as the source wavelength.
Recalibration Service
Recalibration services are available for our power sensors and power meter consoles. We recommend your Thorlabs sensor and console be recalibrated as a pair; however, each may be recalibrated individually. Recalibration of a single-channel power and/or energy meter console or interface is included with the CAL-NS Microscope Slide Peak Power Sensor Recalibration Service below at no additional cost. We recommend yearly recalibration to ensure accuracy and performance. For more information, please contact please contact Tech Support.
| NS170C Specifications | |
|---|---|
| Detector Type | Second-Order Nonlinear Crystal with Silicon Photodiode |
| Laser Wavelength Range | 780 - 1300 nm |
| SHG Wavelength Range | 390 - 650 nm |
| Max Peak Power Densitya | 10 TW/cm2 |
| Laser Average Power Rangeb | 0.5 - 350 mW |
| SHG Optical Power Working Range | 10 nW - 5 mW |
| Responsivity (Click for Plot) |  Click Here for Raw Data |
| Input Aperture | Ø4.5 mm |
| Working Distance | 0.22 mm |
| Linearityc | ±0.5% |
| Resolutionc,d | 1 nW |
| Measurement Uncertaintyc,e | ±3% (440 - 650 nm) ±5% (390 - 439 nm) |
| Response Time | <1 µs |
| Typical Application | GDD Optimization of a Femtosecond Laser at the Focus of a Two-Photon Microscopef |
| Sensor Dimensions | Base: 76.0 mm x 25.2 mm x 5.0 mm (2.99" x 0.99" x 0.20") Overall: 76.0 mm x 30.0 mm x 11.0 mm (2.99" x 1.18" x 0.43") |
| Cable Length | 1.5 m |
| Connector | Sub-D 9 Pin Male |
| Weight | 80 g |
| Post Mounting | Combi Thread 8-32 and M4 |
| Compatible Consolesg | PM100D, PM100A, PM400, and PM5020 |
| Compatible Interfacesg | PM101, PM101A, PM101R, PM101U, PM103, PM103A, PM103E, PM103U, and PM100USB |
Sensor Connector
D-type Male
| Pin | Pin Connections |
|---|---|
| 1 | Not Used |
| 2 | EEPROM Data |
| 3 | Photodiode Anode Ground |
| 4 | Photodiode Cathode |
| 5 | Not Used |
| 6 | EEPROM Ground |
| 7 | Not Used |
| 8 | Not Used |
| 9 | Not Used |
Cleaning
The housing of the NS170C sensor head can be cleaned using a soft damp cloth. The integrated glass sensor cover of the NS170C sensors can be cleaned with appropriate solvents like isopropanol.
Calibration
The calibration of the sensors should remain stable for over a year provided that the unit has not been exposed to excessive optical powers. We recommend yearly recalibration to ensure accuracy and performance, which may be ordered using the CAL-NS item number below. Please contact Tech Support for assistance.
For more details on the graphs below, please see the Operation tab.
 Click to Enlarge
Click Here for Raw Data
Optical filters underneath the β-BBO crystal reject NIR light, allowing only visible second harmonic light to transmit to the silicon photodiode. The blue highlighted regions denote the operating input laser wavelength range (780 - 1300 nm) and converted SHG wavelength range (390 - 650 nm).
 Click to Enlarge
Click Here for Raw Data
Normalized SHG signal of the NS170C power sensor as a function of the microscope objective focal position. Data was collected using an objective with NA = 0.5. The blue highlighted region represents the 30 μm thickness of the β-BBO crystal where the light must be focused in order for appreciable SHG conversion to occur.
 Click to Enlarge
Click Here for Raw Data
Normalized SHG signal of the NS170C power sensor as a function of applied group delay dispersion (GDD). Data was collected for a tunable Ti:sapphire laser centered at 800 nm with 100 fs pulses, and the dispersion was adjusted using an FSPC pulse compressor.
 Click to Enlarge
Click Here for Raw Data
Power of the converted SHG signal as a function of the microscope objective NA. The average laser power through the objective was held constant at 100 mW for each measurement. The spatial frequency acceptance bandwidth of the bulk β-BBO crystal is approximately equal to 0.25 NA. Objectives with an NA much larger than 0.25 will have a reduction in the amount of generated SHG signal.
 Click to Enlarge
Click Here for Raw Data
Power of the converted SHG signal as a function of the input laser's average power. Data was collected for an input laser centered at 950 nm with 56 fs pulses.
 Click to Enlarge
An illustration to show the optical design of the NS170C Microscope Slide Peak Power Sensor. An ultrathin β-BBO crystal is used to convert femtosecond NIR laser pulses into their visible second harmonic. Shortpass filters reflect the residual NIR light, allowing only the visible second harmonic light to transmit to the silicon photodiode sensor.
Nonlinear Crystal with Silicon Photodiode Sensor
The NS170C Microscope Slide Peak Power Sensor was designed to measure the relative peak power of two-photon lasers. As shown in the diagram to the right, the sensor features a 30 µm ultrathin β-BBO crystal that converts incident femtosecond NIR pulses (780 – 1300 nm) into their second harmonic (390 – 650 nm). Shortpass filters underneath the β-BBO crystal reject the residual NIR light, allowing only the visible second harmonic light to transmit down to the large area silicon photodiode sensor (see Graphs tab).
A microscope objective is shown focusing the femtosecond NIR pulses into the β-BBO crystal through a Ø4.5 mm entrance aperture. Because the SHG process requires high peak intensities, the sensor only generates detectable second harmonic light when the ultrathin β-BBO crystal is in the focus of the objective. This means the NS170C sensor is sensitive to the peak power density of the focused femtosecond pulses rather than the average power; therefore, the detected SHG signal can be used as a relative measurement of the lasers' peak intensity. For more details on the generation of second harmonic light using β-BBO crystals, please see the SHG Tutorial tab.
At the top of the NS170C sensor is a standard 170 µm thick cover glass that is sealed to the housing, allowing it to be used with dry, water immersion, and oil immersion objectives. The immersion media can be placed directly on the surface of the cover glass without damaging the sensor. The working distance from the top of the cover glass to the β-BBO crystal is 0.22 mm. Between the cover glass and the β-BBO crystal is an 80 μm air-gap, which is necessary because epoxy or index-matching gel would burn in the focus of the high-intensity femtosecond pulses. While this air-gap causes total internal reflection (TIR) of the highest spatial frequencies when using high NA objectives, the second harmonic process in the β-BBO crystal has a finite spatial frequency acceptance bandwidth, which is exceeded by high NA objectives. Therefore, the highest spatial frequencies rejected by TIR would not appreciably contribute to the SHG process.
The housing of the NS170C sensor shares dimensions with a microscope slide and can fit on standard microscope stages, allowing for measurements of the relative peak power at the focus of a microscope (see Applications tab for details).
Operation
To enhance the efficiency of SHG while using the NS170C sensor, several experimental parameters should be taken into consideration and are described briefly below. For a more detailed description of nonlinear optics and the generation of second harmonic light, please see the SHG Tutorial tab.
- Peak Power: As shown mathematically below, the peak power of the fundamental input laser is dependent on the average power, repetition rate, and pulse duration, thereby influencing the SHG conversion efficiency (see Figure 1 below). Please see the Performance tab for examples of the NS170C sensor's typical performance under various experimental conditions.
- Focal Area: The generation of second harmonic light requires high peak intensities for efficient conversion; therefore, it is typically necessary to focus incident laser light in the SHG crystal. Due to the direct relationship between the crystal's thickness and the recommended focal spot size, the ultrathin 30 μm β-BBO crystal used in the NS170C sensor requires a microscope objective to tightly focus the incident laser light in the crystal. The efficiency of the SHG process decreases substantially as the incident beam diverges from its focus since the pulse energy is distributed across a larger area (see Figure 2 below). Additionally, because the β-BBO crystal has a thickness of 30 µm, the optimum longitudinal position of the focused light is <30 μm in depth. The converted second harmonic light is therefore observed as a brief “flash” in the power meter readout, and focal adjustments should be performed slowly.
- Numerical Aperture: The spatial frequency acceptance bandwidth of the bulk β-BBO crystal in the NS170C sensor is approximately equal to an NA of 0.2. Objectives with numerical apertures much larger than 0.2 will have a reduction in the amount of generated SHG signal and therefore a smaller reported SHG power (see Figure 3 below). It is important to note that the reduced signal with higher NA objectives does not reduce the utility of the device in optimizing the system for maximum imaging performance. This non-intuitive behavior is a limitation of SHG in macroscopic bulk crystals and not an indication that a higher NA objective produces less two-photon absorption or second- and third-harmonic generation from microscopic targets.
- Group Delay Dispersion: β-BBO crystals generate second harmonic light from ultrafast lasers with femtosecond pulse durations. Pulse broadening from group delay dispersion (GDD) occurs as the pulse propagates through optical elements, resulting in a decrease in peak power. Femtosecond Pulse Compressors are used to compensate for the system GDD, making the pulse duration as short as possible (see Figure 4 below). Ideally, the GDD should be optimized after the pulse propagates through all optical elements to ensure the highest peak power, and peak intensity, at the sample. With the integrated cover glass and 0.22 mm working distance, the NS170C sensor allows for GDD optimization directly at the sample plane by simply tuning the GDD while monitoring the SHG output.
- Phase Matching: The SHG process is sensitive to the linear polarization orientation of the incident NIR laser pulses. The knurled phase adjustment wheel on the NS170C sensor housing can be used to tune the angle between the light's polarization orientation and the β-BBO crystal's optical axis, which can provide a 10X enhancement in SHG signal and increase the signal-to-noise ratio. The wheel should be adjusted such that the angle indicator is parallel with the laser polarization state; if the polarization state is unknown, the wheel can be tuned while monitoring the SHG signal to maximize the output.
- Orientation: Degree level changes to the pitch, roll, and yaw of the sensor relative to the incident light can cause changes to the shape of the sensor’s responsivity. Under typical laboratory conditions, the orientation of the sensor can be adjusted by-hand to optimize the SHG signal level; however, users should note that an optimization routine is necessary to establish long-term system performance data or global maximum SHG readings. It is therefore recommended to use a level when mounting the NS170C sensor to ensure consistency in the sensor’s orientation. For singular pulse optimization tasks, less care is necessary in pitch/roll optimization, as the peak power readout through the SHG signal on the power meter will respond appropriately even if it is not the global best orientation.
Click to EnlargeClick Here for Raw Data
Figure 1: Power of the converted SHG signal as a function of the input laser's average power. Data was collected for an input laser centered at 950 nm with 56 fs pulses.
Click to EnlargeClick Here for Raw Data
Figure 2: Normalized SHG signal of the NS170C power sensor as a function of the microscope objective focal position. Data was collected using an objective with NA = 0.5. The blue highlighted region represents the 30 μm thickness of the β-BBO crystal where the light must be focused in order for appreciable SHG conversion to occur.
Click to EnlargeClick Here for Raw Data
Figure 3: Power of the converted SHG signal as a function of the microscope objective NA. The average laser power through the objective was held constant at 100 mW for each measurement. The spatial frequency acceptance bandwidth of the bulk β-BBO crystal is approximately equal to 0.25 NA. Objectives with an NA much larger than 0.25 will have a reduction in the amount of generated SHG signal.
Click to EnlargeClick Here for Raw Data
Figure 4: Normalized SHG signal of the NS170C power sensor as a function of applied group delay dispersion (GDD). Data was collected for a tunable Ti:sapphire laser centered at 800 nm with 100 fs pulses, and the dispersion was adjusted using an FSPC pulse compressor.
| Parameters and Constants | |
|---|---|
| Aeff | Effective Focal Area |
| c | Speed of Light in Vacuum |
| deff | χ2 Tensor Term for Mediating SHG Process |
| Δk | Phase Matching Parameter |
| ε0 | Vacuum Electric Permittivity |
| E | Pulse Energy |
| frep | Repetition Rate |
| L | Length of Nonlinear Crystal |
| n1 | Index of Refraction for Fundamental Laser |
| n2 | Index of Refraction for SHG |
| ηSHG | SHG Efficiency |
| Pavg | Average Power of Fundamental Laser |
| Ppeak | Peak Power of Pulse |
| PSHG | Power of SHG Signal |
| τ | Pulse Duration |
| ω1 | Optical Angular Frequency of Fundamental Laser |
Theory of Operation
The derivation below shows how the NS170C power sensor uses output SHG signal to provide a relative measure of the fundamental laser’s peak power. For a more detailed description of nonlinear optics and the generation of second harmonic light, please see the SHG Tutorial tab. The power of converted SHG signal is defined by

where ηSHG is the efficiency of SHG and Pavg is the average power of the fundamental laser. Using a plane wave model and assuming a simple Gaussian pulse intensity profile,* the efficiency of SHG for input intensity can be defined as

Please see the table to the right for a full list of parameters. Equation (2) yields the relationship

where Ppeak is the peak power of the fundamental laser and Aeff is the effective focal area of the laser spot focused inside the nonlinear crystal. By substituting Equation (3) into Equation (1), the power of converted SHG signal can be represented by
Thus, the power of converted SHG signal is dependent on the peak power of the fundamental laser. The peak power is given by

where E is the pulse energy (defined by E = Pavg /frep), frep is the repetition rate, and τ is the pulse duration of the fundamental laser. Substituting Equation (5) into Equation (4), the power of converted SHG signal can be written as

Therefore, the power of output SHG signal is dependent on the average power, repetition rate, and pulse duration of the fundamental laser, in addition to the focal spot size inside the nonlinear crystal used for SHG.
*A. Yariv and P. Yeh, Optical Waves in Crystals, New York: John Wiley & Sons, 2002, pp. 516-530.
Typical Applications
The NS170C Microscope Slide Peak Power Sensor allows for the relative peak power of two-photon lasers to be measured at the focus of a microscope by utilizing a β-BBO crystal to convert the laser pulses to their second harmonic. Because the efficiency of SHG is proportional to the peak power of the NIR femtosecond pulses, the magnitude of the detected second harmonic light allows for quantitative feedback on the pulses and enables optimization of the experimental system. Below are three typical applications of the NS170C sensor.
Example 1: Optimize Pulse Duration at the Focus of a Microscope
In multiphoton microscopy, pulse broadening from group delay dispersion (GDD) occurs when ultrafast laser pulses propagate through the optical elements in the microscope, resulting in poor image contrast. Femtosecond Pulse Compressors compensate for GDD imparted by the microscope on the laser pulse, ensuring that the pulse arriving at the sample is as short as possible. Because the NS170C sensor shares the same dimensions as a microscope slide and is compatible with most upright and inverted microscope stages, the laser pulse GDD can be optimized directly at the sample plane by simply monitoring the SHG signal output.
The animation here illustrates how the NS170C sensor can be used to optimize the pulse duration of femtosecond laser pulses at the focus of a microscope. The sensor is mounted to a Bergamo® II Multiphoton Imaging Microscope and is connected to a PM400 Optical Power Meter Console to measure the second harmonic signal of femtosecond pulses from a tunable Ti:sapphire laser; an FSPC Femtosecond Pulse Compressor is used to adjust the GDD. The pulse duration at the microscope focus can be optimized using the following procedure:
- Find the focus of the microscope by adjusting the objective position while monitoring the output SHG signal on the power meter. The optimal objective position is reached when the SHG signal is maximized. To minimize the possibility of damaging a component, it is recommended to start with the sensor below the focus and slowly bringing the objective down (or the sensor up) until the beam is focused in the β-BBO crystal. Because the thickness of the β-BBO crystal is 30 µm, the power change during focal position optimization is observed as a brief “flash” in the SHG signal. Adjustments to the objective position should be done slowly as to not miss this "flash" in signal.
- Tune the orientation of the β-BBO crystal by adjusting the wheel on the NS170C sensor while monitoring the output SHG signal on the power meter. The optimal crystal position is reached when the SHG signal is maximized.
- Tune the GDD of the FSPC pulse compressor by rotating the knob on the side of the unit while monitoring the output SHG signal on the power meter. The optimal pulse duration is reached when the SHG signal is maximized.
Example 2: Ensure Consistent Laser Conditions Between Measurements
The NS170C sensor can be used to ensure day-to-day consistency in experimental conditions; however, degree level changes to the pitch, roll, and yaw of the sensor relative to the incident light can cause changes to the shape of the sensor’s responsivity (see Specs tab for details). Under typical laboratory conditions, the orientation of the sensor can be adjusted by-hand to optimize the SHG signal level; however, users should note that an optimization routine is necessary to establish long-term system performance data or global maximum SHG readings. It is therefore recommended to use a level when mounting the NS170C sensor to ensure consistency in the sensor’s orientation. For singular pulse optimization tasks, less care is necessary in pitch/roll optimization, as the peak power readout through the SHG signal on the power meter will respond appropriately even if it is not the global best orientation.
Example 3: Quickly Evaluate the Quality of Femtosecond Laser Pulses
Knowing the typical performance of the NS170C sensor under various experimental conditions can be a useful reference when evaluating the output SHG signal (see Performance tab for details). By comparing the measured SHG signal with the expected performance for a given experiment, the NS170C sensor can quickly and clearly provide feedback on the quality of femtosecond laser pulses that a frequency-resolved optical gating (FROG) measurement would provide. For example, a femtosecond laser that erroneously has picosecond pulses will result in an SHG power orders of magnitude lower than expected. Please see Example 2 above for details on the importance of orientation when using the NS170C sensor as a measure of the systems performance.
Second Harmonic Generation and Phase Matching
Optimizing the intensity and beam quality of the second harmonic light provided by these β-BBO crystals requires choosing the crystal thickness appropriate to the duration of the input laser pulses, determining a focal spot size that balances the positive and negative effects of the focal region, and optimizing the phase matching conditions. Succinct guidance on each of these topics is provided by the graphs available on the Specs tab. Additional information and background, which can be helpful for interpreting the graphed data as well as more effectively using the crystals to generate second harmonic light, is included in the expandable sections below.
Click on a question to expand the corresponding passage that provides an answer, and then click again to contract the section. Answers to questions lower in the list reference the discussions in preceding sections.
What is nonlinear optics?

Click to Enlarge
Figure 1: A beam of light accumulates phase and is attenuated as it propagates through a linear medium, but the photons of the beam do not interact with each other. Due to this, the input (Ein) and output (Eout) electric fields have the same frequency (ω) and are directly proportional.

Click to Enlarge
Figure 2: This nonlinear optical medium supports second harmonic generation and the input light is the same as in Figure 1. In addition to providing fundamental-frequency electric fields, as in Figure 1, the light output from this nonlinear medium also includes frequency doubled light, whose electric field Eout(2ω) is proportional to the square of the total input electric field.
Nonlinear optics refers to different optical phenomena that can occur when light alters the properties of the surrounding material. These phenomena are called nonlinear optics because the strength of the material's response is proportional to the square, cube, or other higher power of the light's total electric field. Since the light usually must be intense to produce a measurable nonlinear response, laser light is often used to generate desired nonlinear effects.
A material's nonlinear response occurs in addition to the linear response, which is proportional to only the first power of the light's electric field. The interaction between the light and the material is completely conventional (linear) when optical and material conditions are not appropriate for generating nonlinear phenomena. In such cases, light waves in a material propagate together without affecting one another, whether or not they are part of the same beam or pulse.
An example of a material's linear response to light is illustrated in Figure 1, in which an input beam is described by its electric field amplitude (Ein), frequency (ω), and polarization orientation (vertical). The beam accumulates phase and experiences conventional losses from effects like reflection and material absorption before it is output, but otherwise the beam is unaffected. The total electric field (Eout) output by the material has an amplitude that is directly proportional to the that of the input beam. In addition, the input and output light has the same frequency and polarization direction.
Nonlinear processes occur when the presence of the light in the material creates conditions in which different light waves can interact with one another. In some cases, light waves from the same beam or pulse interact, and in other cases light waves with significantly different frequencies and / or polarizations interact. Nonlinear phenomena include the generation of new frequencies of light, lensing of laser light propagating in uniform materials, and modulation effects. In the case of frequency generation, the light output by the nonlinear material will include a frequency of light different than any of the input beams' frequencies.
An example of nonlinear frequency generation is illustrated in Figure 2, in which the light is incident on a nonlinear optical material. While the incident light is the same as in Figure 1, the material supports second harmonic generation, and the electric field output from this crystal includes a new color, which has double the frequency of the input beams. The amplitude of this frequency-doubled light is proportional to the square of the total input electric field, and the losses accumulated by the two fundamental-frequency beams include the photons converted into frequency-doubled light.
What is second harmonic generation (SHG)?

Click to Enlarge
Figure 3: This energy diagram shows the input photons on the left and the generated photons on the right. In the case of ideal second harmonic generation the frequency (ω) of the input photons is exactly twice that of the output photon.

Click to Enlarge
Figure 4: This nonlinear optical medium supports second harmonic generation and the input light is the same as in Figure 1. In addition to providing fundamental-frequency electric fields, as in Figure 1, the light output from this nonlinear medium also includes frequency doubled light, whose electric field Eout(2ω) is proportional to the square of the total input electric field. The efficiency of the SHG process is proportional to the square of the of the input light intensity multiplied by a material parameter χ(2).
Second harmonic generation (SHG) is a nonlinear optical process that effectively combines pairs of nominally similar photons into a single photon. This nonlinear process occurs due to interactions between the light and the surrounding material. When the input photons are identical, their frequencies are exactly equal, and this frequency (ω) is called the fundamental frequency. The frequency (2ω) of the generated photon is exactly double the fundamental. In other words, the output light wave's frequency is the second harmonic of the input wave's frequency. This relationship gives SHG its name.
While this seems to suggest the two input photons must have the same frequency, this is not the case. Photons in a beam or pulse of light have frequency values that span a non-zero spectral range around the fundamental frequency. It is possible to combine two photons with frequencies that are different, but within this spectral range. When this occurs, the nonlinear process is typically still called SHG, and the output photons are still described as being frequency doubled. This is also true for input photons from broad-bandwidth femtosecond pulses. However, to simplify the following discussion of SHG, it will be assumed that all input photons have the same fundamental frequency.
Every photon has an energy that is proportional to its frequency. Energy diagrams, like the one shown in Figure 3, typically take advantage of this property to relate the frequencies of photons input to and output by nonlinear optical processes. Each arrow represents the energy of a single photon and is labeled using the photon's frequency. Arrows pointing up correspond to input photons, and arrows pointing down correspond to generated photons. The dotted horizontal lines are typically called virtual energy levels and are not related to energy levels in the material.
The energy diagram illustrates the remarkable fact that nonlinear processes like second harmonic generation are lossless, so that the material does not gain or lose energy as a result of the process. The material provides the specific environment required for the process to occur, and there is interaction between the material and the photons, but no photons are absorbed or emitted by the material during the process. This is the reason the sum of the input photons' energies exactly equals the sum of the output photon's energy.
Not all of the input photons will undergo second harmonic generation as the light propagates through the material. As illustrated in Figure 4, the efficiency of the second harmonic generation process is proportional to the square of the of the input light intensity multiplied by a material specific parameter (χ(2), which is pronounced "kai two"). Values of χ(2) are usually extremely small (on the order of 10-13 m/V), and large input intensities (Io) are typically required for second harmonic generation to be efficient. As the input light intensity increases, the intensity of the frequency doubled (I2ω) light increases relative to the fundamental-frequency output light (Iω).
SHG is a Specific Case of Sum-Frequency Generation
Sum-frequency generation (SFG) is a nonlinear optical process during which input photons are combined into output photons. There are no restrictions on the maximum frequency difference between the input photons. Usually, the term SFG is reserved for cases in which the input photons do not come from the same light source, and / or when the spectra of the input beams or pulses do not overlap.
Second harmonic generation is a specific case of SFG. The nonlinear optical process is typically described as SHG when both photons originate from the same beam or pulse, and the term is especially preferred when frequency doubling the input light. Since SHG combines input photons that have nominally the same energy, second harmonic generation is a degenerate case of SFG.
Can all crystals be used for SHG?
Only optical materials which have a non-zero χ(2) parameter support SHG, and not all crystals fulfill this requirement. An example of a crystal that can be used for SHG is β-BBO. A material is crystalline when its atoms, ions, or molecules are arranged in a repeating pattern. If there is no central point around which the crystal pattern is symmetric (i.e. if the crystal is not centrosymmetric), the crystal has a non-zero χ(2) parameter and can be used for SHG.

Click to Enlarge
Figure 6: When light's oscillating electric field interacts with a centrosymmetric material, an electron's induced potential energy, which is illustrated as a function of the electron's displacement (x) from its equilibrium position, is symmetric and described by a polynomial function consisting of even powers of x.

Click to Enlarge
Figure 5: This cubic crystal structure includes two different ions, A and B, in a repeating pattern. The crystal structure is centrosymmetric since the crystal at point (x, y, z) and its inverse (-x, -y, -z) are identical.

Click to Enlarge
Figure 8: When light's oscillating electric field interacts with a non-centrosymmetric material, an electron's induced potential energy, which is illustrated as a function of the electron's displacement (x) from its equilibrium position, is asymmetric for larger displacements. This curve is described by a polynomial function consisting of even and odd powers of x.

Click to Enlarge
Figure 7: This wurtzite crystal structure includes two different ions, A and B, in a repeating pattern. The crystal structure is not centrosymmetric since there is at least one point (u, v, w) which is not identical to its inverse (-u, -v, -w).
Centrosymmetric Crystal
The repeating crystalline pattern of one type of centrosymmetric crystal is illustrated in Figure 5. As is true for all centrosymmetric crystals, the structure at point (x, y, z) is identical to the structure at the inverse location (-x, -y, -z). Due to the crystal's structural symmetry, the material's response is the same whether the incident light's electric field vector points in one direction or in the opposite direction.
The material’s response to light occurs due to interactions between the light’s oscillating electric field and the electrons in the material. An electron bound to an atom in the material experiences forces contributed by the atom and the light’s electric field, as well as the surrounding atoms in the material. The blue curve in Figure 6 was calculated using the Lorentz model of an atom, which takes these forces into account using a classical mechanics approach. This model can also be used to estimate the χ(2) parameter.
In Figure 6, the X-axis corresponds to the position of the electron, which is in equilibrium at x = 0. The input light’s oscillating electric field moves the electron back-and-forth between positive and negative displacements. The greater the intensity of the electric field, the larger the displacement of the electron. The central and surrounding atoms exert a restoring force on the displaced electron, returning it to equilibrium. This restoring force provides the electron with potential energy, which is plotted on the Y-axis and increases as the electron moves further from equilibrium.
At moderate displacements, the central atom exerts the majority of the restoring force, and the electron’s corresponding potential energy is symmetric and approximately parabolic (the dashed gray curve is a parabolic fit). At larger displacements, achieved using higher-intensity light, surrounding atoms contribute more to the restoring force, as well as the electron’s potential energy. At these larger displacements, the electron’s potential energy deviates from parabolic but remains symmetric.
The symmetric material response is a consequence of the centrosymmetric structure of the crystal. In order to support SHG, this curve would have to be asymmetric. Mathematically, a non-zero χ(2) parameter requires the polynomial describing the curve to include odd powers of x, while the polynomial describing the curve in Figure 6 includes only even powers of x.
Non-Centrosymmetric Crystal
An example of a non-centrosymmetric material is shown in Figure 7. In the case of these materials, there is aways at least one location (u, v, w) for which the crystal structure differs from the crystal structure at the inverse location (-u, -v, -w).
The potential energy of an electron, as a function of its displacement from its equilibrium position, has been calculated for a non-centrosymmetric material using the Lorentz model of the atom (Figure 8). When the incident light has low intensity, the displacement of the electron from its equilibrium position is small, and the majority of the restoring force is provided by the central atom. Within this limited region, the electron's corresponding potential energy function is symmetric and approximately parabolic, which indicates a linear optical material response. When illuminated by higher-intensity light, the electron's displacement is greater and the surrounding atoms contribute more to the restoring force. Since the distribution of the surrounding atoms is not symmetric, neither is the restoring force nor the potential energy well confining the electron for these higher displacements.
The polynomial needed to model this asymmetric curve includes even, as well as odd, powers of x. It is the non-zero cubic (x3) terms in this polynomial that provide a non-zero χ(2) parameter. A third-order polynomial term is required for the generation of the second-order nonlinearities quantified by the χ(2) parameter, since the x3 term is the lowest-order correction to the linear optics model. Because the asymmetric response only becomes significant for larger electron displacements, high-intensity light is required to induce SHG.
Uniaxial Crystal
A secondary requirement for efficient production of second harmonic light, which will be discussed in a section below, is the so-called phase matching condition. At a high level, phase matching is matching of the phase velocities between the input fundamental frequency with the second harmonic frequency. This is frequently accomplished by utilizing the birefringence of anisotropic optical materials.
Uniaxial crystals are a specific type of anisotropic material, where two of the three principal refractive indices are the same. The name “uniaxial” is derived from there being a single propagation axis in these crystals, known as the optical axis or c-axis, on which the index of refraction is the same for all polarization orientations. Many common optical materials belong to the uniaxial class: calcite, quartz, sapphire, and β-BBO.
Reference:
Robert W. Boyd, Nonlinear Optics (Academic Press, New York, 1992) pp. 17 - 52.
Can a crystal's refractive index depend on the light's polarization orientation within the crystal?
Certain materials have a refractive index that depends on the orientation of the light's electric field polarization. An example is birefringent materials, which include uniaxial crystals like β-BBO. Uniaxial crystals characteristically have two principal refractive indices, which are called the ordinary (no) and extraordinary (ne) refractive indices. The principal refractive indices are the maximum and minimum the material can provide. Since light’s electric field (E) is always polarized perpendicular to the propagation direction (k), both the propagation direction and polarization state must be known to determine the refractive indices experienced by the light's polarization components.
A Cartesian coordinate system, with the Z-axis aligned along the crystal’s optic axis (c), can be used to relate the light's polarization components (Ex, Ey, and Ez) to a birefringent crystal's geometry.
In uniaxial crystals, the refractive index can be determined by referencing the angles of the propagation direction and polarization orientation relative to the crystal's optic axis (c).
Since the crystal is uniaxial, the refractive index for fields polarized orthogonal to the crystal's optic axis is no. For fields parallel to the crystal's optic axis, the refractive index is ne. The two components (Ex and Ey) of light polarized orthogonal to the crystal's optic axis have refractive indices equal to no, since the crystal is uniaxial. Light polarized parallel (Ez) to the crystal’s optic axis has a refractive index equal to ne.
It is also possible for birefringent materials to provide a refractive index value between no and ne, which is discussed in a following section.

Click to Enlarge
Figure 9: The diagram on the left indicates the propagation direction (k) of the incident light is along the optic axis (c) of the crystal. The incident light can be decomposed into orthogonal polarization components Ex and Ey. The diagram on the right is a refractive index ellipsoid, with a conic section (red circle) at the XY-plane. This constant-radius circle shows the refractive index is always no in this case and the crystal does not affect the light's polarization.
Light Propagating Parallel to the Optic Axis
(Example: Optical Windows)
Light propagating along the optic axis (Z-axis) of a birefringent material always has a refractive index equal to no. This is a defining trait of the optic axis.
The left side of Figure 9 illustrates the electric field components of light propagating along the crystal's optic axis. These polarization state components can include Ex and Ey, but not Ez. In other words, the electric field vector is orthogonal to the Z-axis, so the angle φ equals 90°. The relative magnitude of Ex and Ey depends on angle α.
The right side of Figure 9 uses an ellipsoidal volume, the so-called index ellipsoid, to map all possible refractive indices provided by the material for all combinations of light propagation directions and polarization orientations. In the case of this material, the maximum possible refractive index is ne and the minimum is no. The opposite can be true for other materials. The red circle drawn on the ellipsoid is a conic section that marks the refractive indices that light propagating along the optic axis will experience. The refractive index of both Ex and Ey components equals no. Due to this, E has a refractive index of no, regardless of the orientation of the E vector in the XY-plane. Therefore, the Ex and Ey components travel with the same phase velocity, and the polarization state stays the same as the light propagates.
Optical windows made from uniaxial crystals, such as sapphire (for example Item # WG31050), are typically cut or polished so that normally incident light propagates parallel to the optic axis. This is done so that the window has no effect on the polarization state of the transmitted light, as described above. When the end faces are orthogonal to the optic axis like this, the crystal is often described as Z-cut or C-cut.

Click to Enlarge
Figure 10: The diagram on the left indicates the incident light's propagation direction (k) and polarization state orientation (E), which can be decomposed into orthogonal components Ex and Ez. The propagation direction is aligned to the Y-axis and is orthogonal (θ = 90°) to the optic axis (c) of the crystal. The diagram on the right is a refractive index ellipsoid, with conic sections (red ellipses) drawn in the XZ- and XY-planes. The refractive index (ne) of the extraordinary component (Ee = Ez) is indicated by the intersection of the Z-axis and ellipse, while the refractive index (no) of the ordinary component (Eo = Ex) is indicated by the intersection of the X-axis and the ellipse. The angle φ determines the two components' relative magnitudes.

Click to Enlarge
Figure 11: The diagram on the left indicates the incident light's propagation direction (k), which is aligned to the Y-axis, which is orthogonal (θ = 90°) to the optic axis (c) of the crystal. Since φ is 0°, the only polarization component is Ez, which is also the extraordinary component. The diagram on the right indicates this component has a refractive index of ne.

Click to Enlarge
Figure 12: The diagram on the left indicates the incident light's propagation direction (k), which is aligned to the Y-axis, which is orthogonal (θ = 90°) to the optic axis (c) of the crystal. Since φ is 90°, the only polarization component is Ex, which is also the ordinary component. The figure on the right indicates this component has a refractive index of no.
Light Propagating Perpendicular to the Optic Axis
(Example: Wave Plate)
When linearly polarized light incident on a birefringent material propagates in a direction orthogonal to the optic axis (θ = 90°), the light may have components polarized both parallel and perpendicular to the optic axis (Z-axis). This is illustrated in Figure 10, in which the light’s propagation direction is aligned to the Y-axis for convenience. The refractive index of the electric field component parallel to the optic axis (Ez) is ne, and the component perpendicular to the optic axis (Ex) is no. This is the largest refractive index difference that can exist between two polarization components in the material.
The vertical, red circle on the right side of Figure 10 is the conic section of the index ellipsoid in a plane perpendicular to the k-vector. The horizontal, red elliptical conic section indicates a difference between the refractive indices of the orthogonal principal polarization axes of ![]() and
and ![]() .
.
Due to different refractive indices, the two polarization components travel at different velocities as they propagate through the material. This causes a phase shift between the two polarization states Ez and Ex.
Wave plates are often fabricated from uniaxial birefringent materials, with the optic polished and mounted so that normally incident light propagates orthogonal to the optic axis. Markings on the wave plate housing, such as the ones on Item # WPQ05M-266, or flat features on the perimeter of the optic, identify the orientations of the ordinary and extraordinary axes, or for a typical waveplate made of crystal quartz the so-called fast and slow axes, respectively.
Light polarized parallel to the fast axis travels with a faster velocity in the material due to the lower refractive index, compared with light polarized parallel to the slow axis. Quartz, a commonly used waveplate material, is a positively uniaxial crystal with a smaller ordinary refractive index compared to its extraordinary index. For quartz, the fast axis is the ordinary axis.
Tuning a wave plate requires rotating the optic in the XZ-plane, around the Y-axis, so that the light's propagation direction is maintained perpendicular to the optic axis. This rotation changes the angle φ, while keeping θ = 90°.
When the angle φ is between 0° and 90°, the linear polarization state has both orthogonal Ex and Ez components, and the wave plate will delay one component relative to the other. However, note that since θ is unchanged, there is no change in the indices of refraction of the two principal orthogonal polarization orientations along ![]() and
and ![]() .
.
When φ = 0°, as illustrated in Figure 11, the light's polarization state is oriented along the optic axis. This provides an extraordinary component (Ez = Ee) without an ordinary component. This component has a refractive index equal to ne. Since there is only one polarization component, the wave plate does not affect the polarization state.
The polarization state is similarly unaffected when the linear polarization state is aligned with the X-axis (φ = 90°), as seen in Figure 12. In this case, there is an ordinary component (Ex = Eo) without an extraordinary component and the refractive index is no.

Click to Enlarge
Figure 13: In the diagram on the left, the propagation direction (k) of the incident light and the optic axis (c) of the uniaxial birefringent crystal are in the same plane (XZ plane). The angle (θ) between k and c is arbitrary. The input fundamental field, represented by the red vector, is parallel to the Y-axis. The SHG light is polarized perpendicularly, represented by the green vector in the XZ plane. Rather than decompose the SHG polarization into components Ex and Ez, the light is typically described as an extraordinary wave (E'e) with a refractive index, n'e. In the diagram on the right, n'e, which depends on θ, is indicated by the intersection of the conic section illustrated by the red ellipse with the XZ plane.

Click to Enlarge
Figure 15: How θ and γ are defined in a laboratory setup.

Click to Enlarge
Figure 14: In the diagram above, the propagation direction (k) of the incident light and the optic axis (c) of the uniaxial birefringent crystal are in the same plane (XZ-plane). The angle (θ) between k and c is arbitrary. In this case, the incident fundamental field (E), represented by the red vector, is rotated off of the laboratory reference frame by an angle γ, and thus only a portion of the fundamental (Eoγ) is converted by SHG into the resulting polarization E'e, represented by the green vector.
Light Propagating at an Arbitrary Angle
(Example: Nonlinear Crystals)
In uniaxial crystals, the field polarizations are arranged as in Figure 13 for Type-I second harmonic generation (SHG). The k-vector is at an angle θ from the optic axis, ![]() , and in the XZ plane. The input fundamental electric field (Eo) is polarized parallel to one of the principal ordinary axes, in this case the Y-axis, and has a refractive index of no. The index of refraction for light polarized in the ordinary direction, parallel to
, and in the XZ plane. The input fundamental electric field (Eo) is polarized parallel to one of the principal ordinary axes, in this case the Y-axis, and has a refractive index of no. The index of refraction for light polarized in the ordinary direction, parallel to ![]() , is independent of changes to θ.
, is independent of changes to θ.
The SHG light is polarized in the XZ plane and is orthogonal to both the Eo and the k-vector. Rather than decompose the polarization of the SHG light into Ex and Ez components, the electric field is typically described as an extraordinary wave (E'e). The refractive index for this extraordinary wave, n'e, changes as a function of θ. n'e(θ) can be calculated using the equation in Figure 13. The ellipse defining the extraordinary index of refraction as a function of θ is a conic section of the index ellipsoid. The two extreme cases are 1) θ = 0°, where the field is polarized along the other principal ordinary axis, ![]() , and the index of refraction is no, or 2), θ = 90°, where the field is polarized along the principal extraordinary axis,
, and the index of refraction is no, or 2), θ = 90°, where the field is polarized along the principal extraordinary axis, ![]() , and the index of refraction is ne. The prime (') notation is used to denote index of refraction for cases in between the two extreme cases of θ.
, and the index of refraction is ne. The prime (') notation is used to denote index of refraction for cases in between the two extreme cases of θ.
Figure 14 shows a departure from an ideal polarization orientation for Type-I SHG, where the incident fundamental field has a linear polarization but is rotated by a degree γ from the principal ordinary axis ![]() . The fundamental field now driving the Type-I SHG process is the Eoγ component of the incident field. At γ = 90°, there would be zero SHG output, since the drive field Eoγ = 0.
. The fundamental field now driving the Type-I SHG process is the Eoγ component of the incident field. At γ = 90°, there would be zero SHG output, since the drive field Eoγ = 0.
In practice, γ is nonzero when the polarization states of light in a laboratory reference frame are not matched to the intrinsic principal axes in the crystal frame. To orient the two reference frames together, e.g. the vertically polarized light from the laser on the optical table is parallel to ![]() in the crystal, we mount the nonlinear crystal in a rotation stage to finely adjust γ to zero, first by eye using the markings on the housing and then further, if necessary, using the SHG output power as feedback. Figure 15 shows the orientation of γ in a laboratory frame rotation of the crystal. In this example case, the nonlinear crystal is mounted in an RSP1 rotation mount on top of an RP01 rotation stage. Changes in γ and θ adjust the orientation of the optic axis,
in the crystal, we mount the nonlinear crystal in a rotation stage to finely adjust γ to zero, first by eye using the markings on the housing and then further, if necessary, using the SHG output power as feedback. Figure 15 shows the orientation of γ in a laboratory frame rotation of the crystal. In this example case, the nonlinear crystal is mounted in an RSP1 rotation mount on top of an RP01 rotation stage. Changes in γ and θ adjust the orientation of the optic axis, ![]() . In this case, adjustments in γ have been used to align
. In this case, adjustments in γ have been used to align ![]() with the horizontal plane and one of the principle ordinary axes vertically. For a vertically polarized input beam, this orientation allows the rotation stage to be used to adjust θ.
with the horizontal plane and one of the principle ordinary axes vertically. For a vertically polarized input beam, this orientation allows the rotation stage to be used to adjust θ.
Why is phase matching (angle tuning) necessary for SHG?

Click to Enlarge
Figure 17: Type-I phase matching can be used with a negative uniaxial crystal like β-BBO. This requires the fundamental frequency (ω) to be polarized perpendicular to the plane that includes the light's propagation vector (k) and the crystal's optic axis (c). The second harmonic light is then polarized parallel to the plane. Angle tuning adjusts θ and is performed by rotating the crystal around the Y-axis.

Click to Enlarge
Figure 16: Without phase matching the intensity of the generated second harmonic light, I(2ω), remains below a low threshold. This intensity can increase exponentially when phase matching is performed.

Click to Enlarge
Figure 19: The refractive index (ne') of the extraordinary wave can be varied between ne and no by tuning the angle (θ) between the crystal's optic axis and the propagation direction of the input ordinary wave. At an angle of 23.37°, fundamental light at 1030 nm is phase matched with SHG light at 515 nm.

Click to Enlarge
Figure 18: The ordinary and extraordinary refractive indices of β-BBO vary with frequency and wavelength due to a material property called dispersion. Dispersion exists in all media except vacuum.
| Wave Type | Angle | Refractive Index |
|---|---|---|
| Ordinary | k ⊥ |
no |
| Extraordinary | θ = 0° | no |
| 0° < θ < 90° | ne'(θ ) | |
| θ = 90° | ne |
Phase matching significantly improves the conversion efficiency and can be required to obtain sufficient frequency-doubled light for applications, but second harmonic generation (SHG) will occur even if phase matching is not performed. The effect of phase matching on the output intensity of SHG light (I2ω) is illustrated in Figure 16. When phase matching is not performed, the intensity of the SHG light alternately increases and decreases, but generally remains at a low level. In contrast, the intensity of phase-matched SHG light can increase exponentially with propagation distance through the material. Phase matching is performed by appropriately orienting the input fundamental frequency (ω) light with respect to the SHG crystal (Figure 17).
With ideal phase matching, the fundamental (ω) and second harmonic (2ω) frequencies travel at the same phase velocity, so that all of the second harmonic light created along the beam path adds constructively. The phase velocity is the rate at which the field carrier, i.e. the sine wave, travels in a material. The rate at which a pulse envelope travels in a material is called the group velocity and defines the speed of the energy packet comprising the optical pulse traveling through the material.
The two frequencies' phase velocities are equal when they have the same refractive index. The refractive indices for these two frequencies are generally not equal, because all media except vacuum are dispersive. This means that a material's refractive index depends on the light's frequency. As an example, β-BBO's principal ordinary and extraordinary refractive indices are graphed, in Figure 18, over a frequency range that extends from the visible into the IR. Over this range, the refractive index increases for higher frequencies.
Several different phase-matching approaches can be used to equalize the refractive indices of the fundamental and second harmonic light. One method, which uses linearly polarized light and the difference between the ordinary and extraordinary refractive indices, is Type-I critical phase matching. This is a common approach for negative uniaxial crystals in which no > ne.
Type-I Phase Matching
The fundamental-frequency input beam and the generated second-harmonic-frequency output beam orientations for Type-I phase matching are illustrated in Figure 17. This is the so-called oo-e arrangement, as the two photons from the fundamental are polarization-oriented along the ordinary axis and the second harmonic photon's polarization is in the extraordinary plane.
The linearly polarized fundamental-frequency wave is aligned to the crystal so that it is input as the ordinary wave. This wave is polarized along the ordinary refractive index axis (Y-axis), which is perpendicular to the plane that includes both the light's propagation vector (k) and the crystal's optic axis (c). The second harmonic frequency wave is generated as an extraordinary wave, which is polarized orthogonal to the fundamental-frequency ordinary wave.
Rotating the crystal around the Y-axis tunes the angle (θ) between the propagation vector and the crystal's optic axis. This varies the extraordinary wave's refractive index (n'e(θ)) between the values of ne and no, as illustrated in Figure 19. The red curve corresponds to n'e(90°) = ne, while the blue curve plots the values for no. The position of the green curve depends on θ. In this case, the angle θ has been tuned to provide a refractive index for 515 nm light that matches the refractive index for 1030 nm light. This tuning angle is therefore optimized for Type-I SHG phase matching and a fundamental-frequency input beam of 1030 nm.
Some manufacturers' SHG crystals, including Thorlabs', provide near-phase-matched conditions for normally incident input light for a specified fundamental frequency. These manufacturers polish the faces of the SHG crystals such that the angle between the normally incident light and the optic axis is the phase-matched angle for the specified frequency. The phase matching angle can be adjusted by rotating the crystal around the y axis. An adjustment that is typically within a few degrees can either optimize the performance of the crystal in the setup or match another fundamental frequency in the crystal's operating range.
Other phase matching conditions are also possible. Critical Type-II phase matching uses an oe-o or eo-e for positive and negative uniaxial crystals. Non-critical phase matching uses crystal temperature to achieve phase matching rather than angular tuning. In quasi-phase matching, the crystal material is “poled” to have up and down domains to counteract the phase-mismatch of the material, where the poling period is specific to the wavelengths of interaction.
Why is short pulse duration a concern for SHG?
When choosing an SHG crystal, the pulse duration of the laser source must be taken into consideration. A mismatch between the duration and crystal thickness will lead to SHG pulses longer in time and narrower in spectral content than possible under ideal conditions.
The issue that arises when using ultrashort pulses for second harmonic generation (SHG) is that shorter pulses have larger bandwidths, but the ideal phase-matched condition can be achieved for only a single fundamental wavelength at a time. Due to this, the quality of the phase match can be significantly worse towards the spectral edges of broad-bandwidth pulses. A second concern is that the group velocity mismatch between the second harmonic and fundamental-frequency pulses will result in one pulse lagging the other as the two propagate. This is called temporal walk-off and will occur even under optimal phase-matched conditions.
Both broad-bandwidth pulses and temporal walk-off cause a reduction in the conversion efficiency, as well as worsen the optical quality of the second harmonic pulses. The appropriate crystal thickness should be chosen to minimize both effects.

Click to Enlarge
Figure 20: On the left, the fundamental input pulse (red) has a spectral width narrower than the reference pulse spectral width (dotted black line). Therefore, the second harmonic pulse spectrum, shown on the right, has a spectral width approximately the same as the ideal case. Ideally, every frequency in the fundamental pulse spectrum would be simultaneously phase matched.

Click to Enlarge
Figure 21: On the left, the fundamental input pulse (red) has a spectral width wider than the reference pulse spectral width (dotted black line). Therefore, the second harmonic pulse spectrum (blue), shown on the right, has a spectral width smaller than in the ideal case. Ideally, every frequency in the fundamental pulse spectrum would be simultaneously phase matched.
Phase Matching Bandwidth Limitations
As discussed in another section, Is phase matching (angle tuning) necessary for SHG?, the angle between the light's propagation direction and the crystal's optic axis can be tuned so that the refractive index of a particular frequency (ω) in the fundamental input pulse exactly equals the refractive index of twice the input frequency (2ω). It is typical to optimize phase matching conditions for the frequency at approximately the center of the pulse's bandwidth. Since the refractive index does not vary linearly with frequency in dispersive crystals like β-BBO, it is not possible to optimally phase match every frequency in the input pulse's spectral range with the corresponding second harmonic frequency in the generated pulse.
Assuming a crystal of a given thickness, it is possible to define a reference pulse with a spectral range that is the maximum that can be adequately phase matched. This spectral bandwidth limitation can also be thought of in terms of an SHG spectral filter whose passband depends on both the specific crystal and the pulse's center frequency. Frequencies outside of this filter’s passband will be rejected from undergoing the SHG process.
When an input pulse's spectral range is equal to or narrower than the reference pulse, the generated second harmonic pulse has a duration that is shorter by a factor of 1/√2 and a spectral width that is broader by a factor of √2. Physically, when the fundamental spectrum is well within the reference pulse spectrum, the SHG pulse intensity profile is the square of the fundamental intensity profile, effectively truncating the duration. This case is illustrated in Figure 20.
When the input pulse has a spectral range that exceeds the width of the reference pulse (Figure 21), the second harmonic pulse spectrum (blue curve) is narrower than it would be if all frequencies in the input pulse were phase matched (gray curve). The spectrally narrowed SHG pulse spectrum is said to be apodized, since an effect of the fundamental pulse exceeding the maximum input bandwidth limit is the removal of the highest and lowest frequencies from the SHG pulse spectrum.
The length of the SHG crystal significantly affects the spectral width of the reference pulse, or alternatively the bandwidth of the SHG filter. As illustrated in the following table, the shorter the crystal, the wider the reference pulse spectrum. The table below assumes a fundamental center wavelength in the near-IR.
| β-BBO Crystal Length | Pulse Durationa |
|---|---|
| Less than One Millimeter | Less than 100 Femtoseconds |
| Several Millimeters | Hundreds of Femtoseconds |
| Tens of Millimeters | Picoseconds |
Temporal Walk-Off
There are two velocities that define the propagation of light in optical media: the phase and group velocities. The phase velocity is the speed of the carrier, the oscillation of the electric field, and the velocity that is matched between the fundamental and second harmonic frequencies for phase matching. The phase velocity relative to the speed of light in a vacuum is defined by the index of refraction.

Click to Enlarge
Figure 22: The diagram at the top shows two pulses with different center frequencies incident on a material. The group velocity delay between the pulses when they enter the material is zero. The four lower figures illustrate that the group velocity delay (temporal walk-off) increases as the pulses propagate through the material. The temporal walk-off is illustrated for distances Z0 through Z3, which are indicated on the diagram at top.
The group velocity is the speed of the pulse, or more formally the envelope of the electric field. The group index similarly governs the speed of the envelope relative to the speed of light in a vacuum and is dependent on the dispersion of the material. The group velocity and the phase velocity are not equal, meaning the sine wave of the carrier and the envelope of the pulse move through optical media at different speeds.
The group velocities of the fundamental and second harmonic pulses are also different, even when phase-matched, and the magnitude of the group velocity mismatch depends on the crystal properties and the optical frequencies in the pulses. In some cases, the mismatch can be small. For example, when a β-BBO crystal is used to frequency double 1550 nm light and provide 775 nm light, the group velocity mismatch is only a few femtoseconds per millimeter.
However, in many cases, the difference in the fundamental and second harmonic pulse velocities can cause one pulse to significantly lag the other. The temporal walk-off of the slower pulse with respect to the faster can be a substantial fraction of the pulse duration. This is illustrated in Figure 22.
The temporal walk-off is often considered severe when the temporal lag exceeds the duration of the fundamental pulse. Severe walk-off can result in temporal lag that irreparably increases the duration of the output second harmonic pulse. Since the dynamics of this process are highly subject to experimental parameters, it is difficult to arbitrarily predict the precise effects on the second harmonic pulse. These effects can include back conversion, in which second harmonic light is converted back to fundamental light, and spectral narrowing of the SHG pulse.
Choosing Crystal Thickness
The length of the crystal is an important parameter to consider when optimizing the SHG process for the parameters of particular input pulses. Absent phase-matching and temporal walk-off effects, the SHG output increases exponentially with crystal length. The goal when picking an SHG crystal is to balance the crystal length with the limitations determined by the fundamental pulse. Decreasing the crystal thickness reduces effects related to both phase-matching bandwidth limitations and temporal walk-off, which are directly related. For example, consider a fundamental pulse propagating over a given crystal thickness. When the temporal walk-off is greater than the duration of the fundamental pulse, this pulse will also have a spectral bandwidth that greatly exceeds the spectral width of the reference pulse. A general rule for limiting the detrimental effects related to both physical effects is to choose a crystal thickness that limits the fundamental and second harmonic temporal walk-off to no more than the duration of the fundamental pulse.
Why is focal spot size important to consider?
It is typically necessary to focus the incident light in the crystal for SHG applications, since efficient generation of second harmonic light requires high peak intensities, such as 109 W/cm2. When using femtosecond pulses with moderate energies in the nanojoule range, obtaining the required peak intensities can require small focal spots. A recommended guideline for focusing femtosecond laser pulses into a nonlinear crystal is to maintain a Rayleigh range that is at least several times longer than the length of the SHG crystal. This minimizes the chance of damaging the crystal, as well as reduces the negative effects of spatial phase mismatch and spatial (Poynting vector) walk-off.
| Ti:Sapphire Laser Pulse Parameters | ||
|---|---|---|
| Wavelength |  |
800 nm |
| FWHM Duration | T | 140 fs |
| Energy | E | 30 nJ |
| β-BBO Crystal | ||
| Thickness | d | 0.6 mm |
| Focused Pulse Parameters | ||
| Mode Field Diametera | MFD | 13.5 µm |
| Effective Areab | 7.16 x 10⁻⁷ cm2 | |
| Peak Power |  |
201 kW |
| Peak Irradiancec | 281 GW/cm2 | |

Click to Enlarge
Figure 23: This diagram illustrates a beam's focal region in a uniaxial birefringent material. Straight lines, representing rays, are drawn through the center of the beam waist. As the beam diverges from the beam waist, the energy in the beam is distributed over a larger cross sectional area. The crystal axis is c. The chief ray is parallel to the direction used to measure the tuning angle (θ), which is optimized during phase matching. Conversion efficiency is optimized for rays parallel to the chief ray and worse for rays at larger angles (ψ) to the chief ray.
Rayleigh Length vs. Crystal Thickness
When laser light is focused to a spot, the diameter of the beam waist is the focal spot size, and the rate at which the light diverges from the beam waist is related to the Rayleigh range (zR). The Rayleigh range quantifies the distance, measured from the beam waist, over which the beam diameter is approximately constant. The shorter the Rayleigh range, the larger the rate of divergence.
When the Rayleigh range is less than the crystal thickness, the distance over which the beam is optimally intense is less than the crystal thickness. The efficiency of the SHG process decreases substantially as the fundamental beam diverges from its focus, since the pulse energy is distributed across a larger beam cross section.
For femtosecond pulses the phase-matching/temporal walk-off limitations will set the crystal length to be relatively short (sub-mm to a few-mm). As will be discussed below, there is a focusing numerical aperture (NA) limitation to the SHG phase-matching process exactly analogous to the spectral phase matching limitation discussed in the previous section (Why is short pulse duration a concern for SHG? Phase Matching Bandwidth Limitations). This spatial focusing constraint on the SHG process will generally result in the crystal length always being less than the Rayleigh range of the input focused pulse.
Crystal Damage
There is the danger of exceeding the laser-induced damage threshold (LIDT) when ultrafast pulses are focused to small spot sizes. As an example, consider femtosecond pulses from a typical Ti:sapphire laser (see table to the right). Selecting the crystal thickness based on the pulse duration to balance maximum length with phase-matching/temporal walk-off limitations, the 0.6 mm crystal would be recommended for the 140 fs pulse at 800 nm. If the focal spot were chosen such that the 2zR = Crystal Length, then the focal spot size would be 13.5 μm. Using the equations provided in the table, the 30 nJ input Gaussian pulse is estimated to provide the notably high peak intensity (irradiance) of 281 GW/cm2 on the crystal's input face.
Spatial Phase Matching
The Type-I phase matching process relies on matching the ordinary and extraordinary indices of refraction for the fundamental and second-harmonic frequencies, which is achieved through precise orientation of the crystal optic axis and input propagation vector. A focused laser pulse, or beam, has angular content, formally called spatial frequencies, to produce the small focal spot. We use Numerical Aperture (NA) to describe the extent of this angular content. Ideally, the fundamental laser light would be collimated throughout the crystal, since collimated light resembles a group of rays aligned to the same direction with an NA of zero.
From a ray-model perspective, the propagation direction defines the orientation of the central (chief) ray in Figure 23. The SHG process is affected by the range of angles over which incident light propagates, because light that is not parallel to the chief ray has reduced phase-matching relative to the chief ray. Instead of the reference pulse power spectrum comprising an apodization filter, in the spatial domain the filter would be in NA. The angular domain apodization filter however, is only in one-dimension defined by the plane k and ![]() .
.
The angular content of a focused beam can be visualized by tracing rays from the lens to the focal spot. Each ray drawn from the lens to a tightly focused spot (Figure 23) makes a different angle (ψ) with the chief ray, and the range of angles increases with the NA. As the range of angles increases beyond the reference NA filter (or angular domain apodization filter width), the phase-matching of the rays outside of the filter width diminishes therefore reducing the SHG conversion efficiency of those rays. The angular content of the resultant SHG pulse, or beam, in the dimension of the angular filter is reduced from an ideal case. In the perpendicular dimension, the SHG beam preserves the angular content of the input beam, since there’s no angular filter in that dimension. A diverging beam with asymmetric NA’s, i.e. in the horizontal and vertical dimensions, leads to an elliptical beam.
Spatial (Poynting Vector) Walk-Off
As the second harmonic light propagates, its energy flows in a different direction than that of the fundamental light. The spatial walk-off angle depends on the size of the beam and the crystal length. While the angle can be significant, it is usually small, typically on the order of 10 mrad, and can be neglected.
In the case of Type-I phase matching and β-BBO crystals, the fundamental light propagates as an extraordinary wave in the crystal, while the second harmonic light propagates as an ordinary wave. The energy in both waves propagates in directions determined by their Poynting vectors. Snell's law does not describe the direction of energy flow, but it can be used to calculate the direction of the k-vector in the crystal.
Pulsed Laser Emission: Power and Energy Calculations

Determining whether emission from a pulsed laser is compatible with a device or application can require referencing parameters that are not supplied by the laser's manufacturer. When this is the case, the necessary parameters can typically be calculated from the available information. Calculating peak pulse power, average power, pulse energy, and related parameters can be necessary to achieve desired outcomes including:
- Protecting biological samples from harm.
- Measuring the pulsed laser emission without damaging photodetectors and other sensors.
- Exciting fluorescence and non-linear effects in materials.
Pulsed laser radiation parameters are illustrated in Figure 1 and described in the table. For quick reference, a list of equations is provided below. The document available for download provides this information, as well as an introduction to pulsed laser emission, an overview of relationships among the different parameters, and guidance for applying the calculations.
|
Equations: |
||||
 |
and |  |
||
 |
||||
 |
||||
 |
||||
Peak power and average power calculated from each other: |
||||
 |
and |  |
||
| Peak power calculated from average power and duty cycle*: | ||||
 |
*Duty cycle ( ) is the fraction of time during which there is laser pulse emission. ) is the fraction of time during which there is laser pulse emission. |
|||
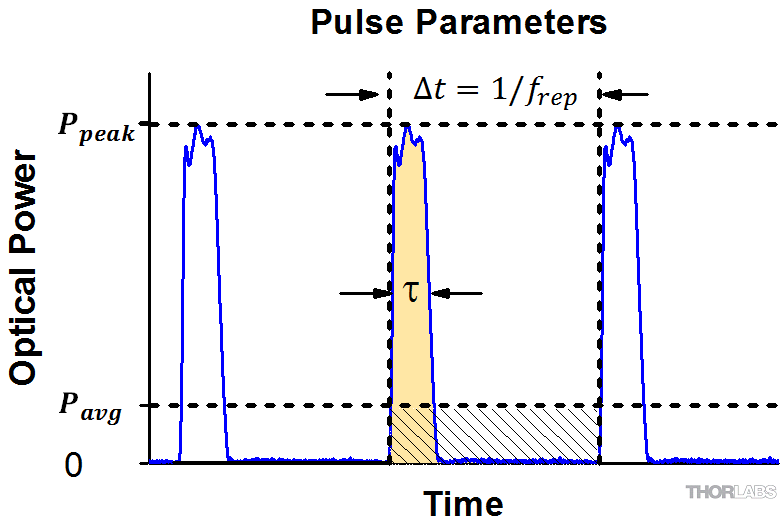
Click to Enlarge
Figure 1: Parameters used to describe pulsed laser emission are indicated in the plot (above) and described in the table (below). Pulse energy (E) is the shaded area under the pulse curve. Pulse energy is, equivalently, the area of the diagonally hashed region.
| Parameter | Symbol | Units | Description | ||
|---|---|---|---|---|---|
| Pulse Energy | E | Joules [J] | A measure of one pulse's total emission, which is the only light emitted by the laser over the entire period. The pulse energy equals the shaded area, which is equivalent to the area covered by diagonal hash marks. | ||
| Period | Δt | Seconds [s] | The amount of time between the start of one pulse and the start of the next. | ||
| Average Power | Pavg | Watts [W] | The height on the optical power axis, if the energy emitted by the pulse were uniformly spread over the entire period. | ||
| Instantaneous Power | P | Watts [W] | The optical power at a single, specific point in time. | ||
| Peak Power | Ppeak | Watts [W] | The maximum instantaneous optical power output by the laser. | ||
| Pulse Width |  |
Seconds [s] | A measure of the time between the beginning and end of the pulse, typically based on the full width half maximum (FWHM) of the pulse shape. Also called pulse duration. | ||
| Repetition Rate | frep | Hertz [Hz] | The frequency with which pulses are emitted. Equal to the reciprocal of the period. | ||
Example Calculation:
Is it safe to use a detector with a specified maximum peak optical input power of 75 mW to measure the following pulsed laser emission?
- Average Power: 1 mW
- Repetition Rate: 85 MHz
- Pulse Width: 10 fs
The energy per pulse:

seems low, but the peak pulse power is:

It is not safe to use the detector to measure this pulsed laser emission, since the peak power of the pulses is >5 orders of magnitude higher than the detector's maximum peak optical input power.
Thorlabs offers a wide selection of optics optimized for use with femtosecond and picosecond laser pulses. Please see below for more information.
| Low-GDD Mirrors | |||||
|---|---|---|---|---|---|
 |
 |
 |
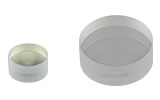 |
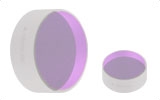 |
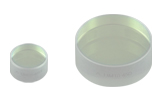 |
| 355 - 445 nm | 460 - 590 nm | 700 - 930 nm | 970 - 1150 nm | 1400 - 1700 nm | 1760 - 2250 nm |
| Dielectric Mirror | High-Power Mirrors for Picosecond Lasers |
Metallic Mirrors | Low-GDD Pump-Through Mirrors |
||
|---|---|---|---|---|---|
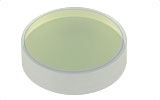 |
 |
 |
 |
 |
 |
| Dual-Band Dielectric Mirror, 400 nm and 800 nm |
Ytterbium Laser Line Mirrors, 250 nm - 1080 nm |
Ultrafast-Enhanced Silver Mirrors, 750 - 1000 nm |
Protected Silver Mirrors, 450 nm - 20 µm |
Unprotected Gold Mirrors, 800 nm - 20 µm |
Pump-Through Mirrors, 1030 - 1080 nm and 940 - 980 nm |
| Deterministic GDD Beamsplitters |
Low-GDD Harmonic Beamsplitters |
Low-GDD Polarizing Beamsplitters |
β-BBO Crystals | Dispersion-Compensating Optics | |
|---|---|---|---|---|---|
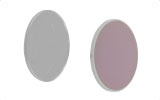 |
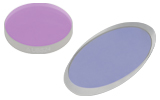 |
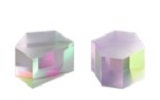 |
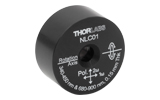 |
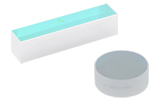 |
 |
| Beamsplitters & Windows, 600 - 1500 nm or 1000 - 2000 nm |
Harmonic Beamsplitters, 400 nm and 800 nm or 500 nm and 1000 nm |
High-Power, Broadband, High Extinction Ratio Polarizers, 700 - 1300 nm | β-BBO Crystals for Second Harmonic Generation |
Dispersion-Compensating Mirrors, 650 - 1050 nm |
Dispersion-Compensating Prisms, 700 - 900 nm |
| Posted Comments: | |
Chen-Hsun Chou
(posted 2024-08-23 13:52:22.697) Hi, I'm looking for an alternative to an autocorrelator. I understand that the NS170C measures peak power, and since peak power is highest when the pulse width is shortest, I was wondering if a peak power sensor could replace an autocorrelator. What are the key differences between an autocorrelator and a peak power sensor? |

 Zoom
Zoom Click to Enlarge
The back of the NS170C housing is engraved with the sensor specifications and a target for centering the beam on the sensor.
- Utilizes a β-BBO Crystal to Measure the Relative Peak Power of Two-Photon Lasers
- Laser Wavelength Range: 780 - 1300 nm
- Second-Harmonic Wavelength Range: 390 - 650 nm
- Ideal for Optimizing Laser Conditions at the Sample Plane of a Microscope
- Compatible with Dry, Water Immersion, and Oil Immersion Objectives
- Yearly Recalibration with CAL-NS Recalibration Service Recommended (For More Information, Contact Tech Support)
The NS170C Microscope Slide Peak Power Sensor is designed to measure the relative peak power of lasers for multiphoton microscopy. It can be used with femtosecond lasers with center wavelengths from 780 nm to 1300 nm. To avoid damaging the optical components, the maximum average power should not exceed 350 mW. The damage threshold for the peak power density is 10 TW/cm2 at 80 MHz repetition rate and for microscope objectives with NA > 0.5; the damage threshold will be lower for NA < 0.5. The photodiode sensor can detect SHG light with wavelengths from 390 nm to 650 nm at optical powers from 10 nW to 5 mW. Please see the Specs tab for more information.
The converted SHG signal of the NS170C peak power sensor is highly dependent on the experimental conditions (see Operation tab for details). The wavelength, pulse duration, quality of the temporal pulse profile, repetition rate, and power of the NIR input laser in addition to the objective numerical aperture and immersion all contribute to the magnitude of the converted visible SHG signal. The table below describes the typical performance of the NS170C peak power sensor under various experimental conditions and can be used as a reference when evaluating the expected SHG signal for a given experiment.
Thorlabs recommends yearly recalibration of the NS170C sensor. Thorlabs offers a recalibration service for this photodiode sensor, which can be ordered below (Item # CAL-NS). Recalibration of a single-channel power and/or energy meter console or interface is included with the recalibration of a sensor at no additional cost. For more information, please contact Tech Support.
 Click to Enlarge
The NS170C sensor may be post mounted via the 8-32 (M4 x 0.7) tap in the side of the housing.
| NS170C Typical Performancea | |||||
|---|---|---|---|---|---|
| Immersion | Laser Power at Sampleb | Wavelength | Pulse Duration | Objective | SHG Signal |
| Air | 100 mW | 780 nmc | 80 fs | 20X, 0.5 NAf | 980 µW |
| 800 nmc | 100 fs | 1100 µW | |||
| 900 nmc | 960 µW | ||||
| 920 nmd | 150 fs | 10X, 0.3 NAg | 216 µW | ||
| 920 nme | 10X, 0.5 NAh | 580 µW | |||
| 1000 nmc | 180 fs | 20X, 0.5 NAf | 400 µW | ||
| 350 mW | 800 nmc | 100 fs | 5500 µW | ||
| Water | 100 mW | 800 nmc | 100 fs | 40X, 0.8 NAi | 255 µW |
Our most popular power meter consoles are included here for convenience. The PM100D digital power meter console features a back-lit LED screen and includes a 1 GB external SD memory card. The PM400 touch screen power meter console can perform the same functions as the PM100D with added features that include storing past power measurements in its 4 GB internal memory, inputs for external temperature and humidity sensors, programmable GPIO ports, and a capacitive touchscreen display that allows the unit to be operated with multi-touch gestures. Additionally, the PM400 allows optical power measurement data, temperature logs, spectral correction curves, and attenuation correction data can be saved by the user and transferred between the console and an external device for further analysis. These functions are particularly useful for tracking the consistency of the power at the sample plane over time. For more information, click on the part number in the table below to view the complete presentation for each power meter console.
Alternatively, the NS170C sensor is compatible with the PM5020 and the previous-generation PM200 and PM320E consoles. It can also be used with the PM100 series, PM100USB, and PM103 series interfaces.
| Item # | PM100A | PM100D | PM400 |
|---|---|---|---|
| Console Image (Click the Image to Enlarge) |
 |
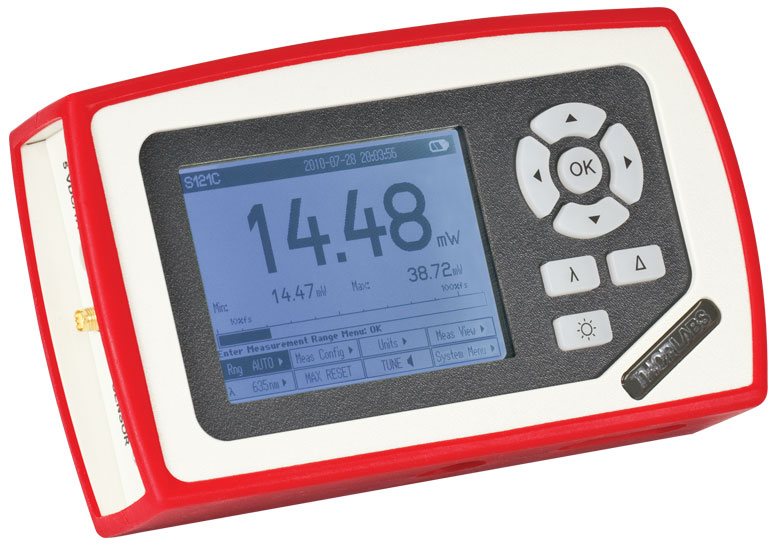 |
 |
| Display | Mechanical Needle and LCD Display with Digital Readout |
320 x 240 Pixel Backlit Graphical LCD Display |
Projected Capacitive Touchscreen with Color Display |
| Output | Analog Needle or Digital Numeric Readout | Numerical, Bar Graph, Statistics, Simulated Analog Needle |
Numerical with Bar Graph, Trend Graph (Power or Energy and Temperature), Statistics, Simulated Analog Needle |
| Calibration Functions | Wavelength Correctiona | Wavelength Correctiona | Wavelength Correctiona; Also Accepts User-Input Source Spectra and Attenuation Correction Data |
| Data Storage and Transfer | USB 2.0 Interface | 1 GB External SD Memory Card, USB 2.0 Interface |
4 GB Internal Memory Mini B USB 2.0 Interface |
| Dimensions | 7.24" x 4.29" x 1.61" (184 mm x 109 mm x 41 mm) |
7.09" x 4.13" x 1.50" (180 mm x 105 mm x 38 mm) |
5.35" x 3.78" x 1.16" (136.0 mm x 96.0 mm x 29.5 mm) |
| Display Dimensions | 1.9" x 0.5" (48.2 mm x 13.2 mm) Digital Display and 3.54" x 1.65" (90.0 mm x 42.0 mm) Analog Display |
3.17" x 2.36" (81.4 mm x 61.0 mm) |
3.7" x 2.1" (95 mm x 54 mm) |
| Calibration Service Item # |
Compatible Microscope Slide Power Sensor |
|---|---|
| CAL-NS | NS170C |
Thorlabs offers a recalibration service for our microscope slide peak Power sensor. To ensure accurate measurements, we recommend recalibrating the sensor annually. Recalibration of a single-channel power and/or energy meter console or interface is included with the recalibration of a sensor at no additional cost. If you wish to calibrate one or more sensors with a dual-channel console, each sensor and console calibration service will need to be purchased individually.
Refer to the table to the right for the appropriate calibration service Item # that corresponds to your microscope slide power sensor.
Requesting a Calibration
Thorlabs provides two options for requesting a calibration:
- Complete the Returns Material Authorization (RMA) form. When completing the RMA form, please enter your name, contact information, the Part #, and the Serial # of the item being returned for calibration; in the Reason for Return field, select "I would like an item to be calibrated." All other fields are optional. Once the form has been submitted, a member of our RMA team will reach out to provide an RMA Number, return instructions, and to verify billing and payment information.
- Select the appropriate sensor calibration Item # below, enter the Part # and Serial # of the sensor that requires recalibration, and then Add to Cart. If you would like a console calibrated with your sensor, repeat this process for Item # CAL-PM1 or CAL-PM2 below, entering the console Item # and Serial #. A member of our RMA team will reach out to coordinate the return of the item(s) for calibration. Note that each console calibration Item # represents the cost of calibrating a console alone; if requesting a single-channel console calibration with a sensor calibration, the appropriate discount will be applied when your request is processed. Should you have other items in your cart, note that the calibration request will be split off from your order for RMA processing.
Please Note: To ensure your item being returned for calibration is routed appropriately once it arrives at our facility, please do not ship it prior to being provided an RMA Number and return instructions by a member of our team.
| Calibration Service Item # | Compatible Consoles & Interfaces |
|---|---|
| Single-Channel | |
| CAL-PM1 | PM100D, PM100A, PM400, PM100USB, PM101 Series, PM102 Series, PM103 Series |
| Dual-Channel | |
| CAL-PM2 | PM5020, Previous-Generation PM320E |
These recalibration services are for the power and/or energy meter electronics of our consoles and interfaces. To ensure accurate measurements, we recommend recalibrating annually. Recalibration of a single-channel console or interface is included with these sensor recalibration services at no additional cost. If you wish to calibrate one or more sensors with a dual-channel console, each sensor and console calibration service will need to be purchased individually. For more details on these recalibration services, please click the Documents (![]() ) icons below.
) icons below.
The table to the upper right lists the power and/or energy meter consoles and interfaces that can be calibrated using the CAL-PM1 and CAL-PM2 recalibration services.
Requesting a Calibration
Thorlabs provides two options for requesting a calibration:
- Complete the Returns Material Authorization (RMA) form. When completing the RMA form, please enter your name, contact information, the Part #, and the Serial # of each item being returned for calibration; in the Reason for Return field, select "I would like an item to be calibrated." All other fields are optional. Once the form has been submitted, a member of our RMA team will reach out to provide an RMA Number, return instructions, and to verify billing and payment information.
- Select the appropriate Item # below, enter the Part # and Serial # of the item that requires recalibration, and then Add to Cart. If you would like to calibrate one or more sensors with your console, repeat this process for the appropriate sensor recalibration service above, entering the console Item # and Serial #. A member of our RMA team will reach out to coordinate return of the item(s) for calibration. Note that each console calibration Item # represents the cost of calibrating a console alone; if requesting a single-channel console calibration with a sensor calibration, the appropriate discount will be applied when your request is processed. Should you have other items in your cart, note that the calibration request will be split off from your order for RMA processing.
Please Note: To ensure your item being returned for calibration is routed appropriately once it arrives at our facility, please do not ship it prior to being provided an RMA Number and return instructions by a member of our team.